Estimated zip code population in 2022: 2,625 Zip code population in 2010: 2,776 Zip code population in 2000: 2,327
Houses and condos: 1,454 Renter-occupied apartments: 165
% of renters here:
15%
State:
38%
March 2022 cost of living index in zip code 75770: 84.4 (less than average, U.S. average is 100)
Land area: 120.8 sq. mi. Water area: 3.3 sq. mi.
Population density: 22 people per square mile
(very low).
OSM Map
General Map
Google Map
MSN Map
OSM Map
General Map
Google Map
MSN Map
OSM Map
General Map
Google Map
MSN Map
OSM Map
General Map
Google Map
MSN Map
Please wait while loading the map...
Real estate property taxes paid for housing units in 2022:
This zip code:
0.8% ($1,971)
Texas:
1.5% ($4,050)
Median real estate property taxes paid for housing units with mortgages in 2022: $2,065 (0.7%) Median real estate property taxes paid for housing units with no mortgage in 2022: $1,819 (1.0%)
Business Search- 14 Million verified businesses
Males: 1,236
(47.1%)
Females: 1,389
(52.9%)
For population 25 years and over in 75770:
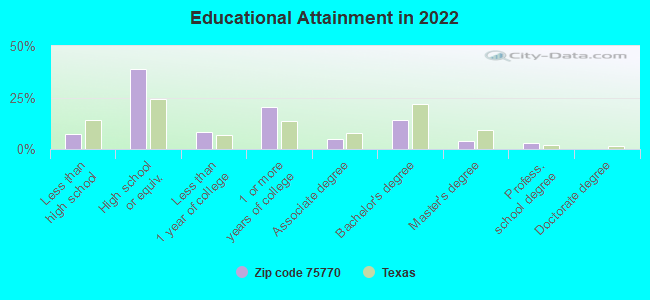
High school or higher: 91.4%
Bachelor's degree or higher: 20.5%
Graduate or professional degree: 6.8%
Unemployed: 2.2%
Mean travel time to work (commute): 37.3 minutes
For population 15 years and over in 75770:
Never married: 19.0%
Now married: 66.1%
Separated: 0.1%
Widowed: 4.2%
Divorced: 10.5%
Zip code 75770 compared to state average:
Unemployed percentage below state average.
Hispanic race population percentage significantly below state average.
Median age significantly above state average.
Foreign-born population percentage significantly below state average.
Renting percentage significantly below state average.
Length of stay since moving in significantly above state average.
Averages for the 2020 tax year for zip code 75770, filed in 2021:
Average Adjusted Gross Income (AGI) in 2020: $70,872 (Individual Income Tax Returns)
Here:
$70,872
State:
$77,054
Salary/wage: $51,177 (reported on 76.8% of returns)
Here:
$51,177
State:
$62,766
(% of AGI for various income ranges: 1198.9% for AGIs below $25k, 3709.2% for AGIs $25k-50k, 5807.5% for AGIs $50k-75k, 9460.0% for AGIs $75k-100k, 14460.8% for AGIs $100k-200k)
Taxable interest for individuals: $1,325 (reported on 29.0% of returns)
This zip code:
$1,325
Texas:
$2,665
(% of AGI for various income ranges: 23.4% for AGIs below $25k, 38.8% for AGIs $25k-50k, 77.5% for AGIs $50k-75k, 18.6% for AGIs $75k-100k, 66.7% for AGIs $100k-200k)
Ordinary dividends: $9,242 (reported on 17.4% of returns)
Here:
$9,242
State:
$10,044
(% of AGI for various income ranges: 30.9% for AGIs below $25k, 60.4% for AGIs $25k-50k, 103.3% for AGIs $50k-75k, 201.4% for AGIs $75k-100k, 348.3% for AGIs $100k-200k)
Net capital gain/loss in AGI: +$27,912 (reported on 18.1% of returns)
Here:
+$27,912
State:
+$39,590
(% of AGI for various income ranges: 8.9% for AGIs below $25k, 28.7% for AGIs $25k-50k, 212.5% for AGIs $50k-75k, 101.4% for AGIs $75k-100k, 1091.7% for AGIs $100k-200k)
Profit/loss from business: +$9,815 (reported on 19.6% of returns)
Here:
+$9,815
State:
+$10,888
(% of AGI for various income ranges: 144.0% for AGIs below $25k, 196.7% for AGIs $25k-50k, 274.2% for AGIs $50k-75k, 1120.8% for AGIs $100k-200k)
Taxable individual retirement arrangement distribution: $24,175 (reported on 11.6% of returns)
75770:
$24,175
Texas:
$24,740
(% of AGI for various income ranges: 53.4% for AGIs below $25k, 128.8% for AGIs $25k-50k, 758.3% for AGIs $50k-75k, 2051.7% for AGIs $100k-200k)
Total itemized deductions: $38,488 (reported on 5.8% of returns)
Here:
$38,488
State:
$40,428
(% of AGI for various income ranges: 145.4% for AGIs below $25k, 540.8% for AGIs $50k-75k, 733.3% for AGIs $100k-200k)
Charity contributions: $13,250 (reported on 5.8% of returns)
Here:
$13,250
State:
$18,201
(% of AGI for various income ranges: 201.7% for AGIs $50k-75k, 213.3% for AGIs $100k-200k)
Taxes paid: $7,075 (reported on 5.8% of returns)
75770:
$7,075
State:
$7,821
(% of AGI for various income ranges: 175.0% for AGIs $50k-75k, 122.5% for AGIs $100k-200k)
Earned income credit: $2,204 (reported on 20.3% of returns)
Here:
$2,204
State:
$2,584
(% of AGI for various income ranges: 124.0% for AGIs below $25k, 76.2% for AGIs $25k-50k)
Percentage of individuals using paid preparers for their 2020 taxes: 94.2%
Here:
94%
State:
92%
(% for various income ranges: 94.0% for AGIs below $25k, 94.1% for AGIs $25k-50k, 94.4% for AGIs $50k-75k, 100.0% for AGIs $75k-100k, 90.0% for AGIs $100k-200k, 100.0% for AGIs over 200k)
Averages for the 2012 tax year for zip code 75770, filed in 2013:
Average Adjusted Gross Income (AGI) in 2012: $55,291 (Individual Income Tax Returns)
Here:
$55,291
State:
$65,384
Salary/wage: $44,473 (reported on 79.8% of returns)
Here:
$44,473
State:
$52,524
(% of AGI for various income ranges: 72.3% for AGIs below $25k, 80.2% for AGIs $25k-50k, 80.5% for AGIs $50k-75k, 73.6% for AGIs $75k-100k, 66.8% for AGIs $100k-200k, 33.2% for AGIs over 200k)
Taxable interest for individuals: $1,052 (reported on 31.7% of returns)
This zip code:
$1,052
Texas:
$2,372
(% of AGI for various income ranges: 1.3% for AGIs below $25k, 0.4% for AGIs $25k-50k, 0.7% for AGIs $50k-75k, 0.2% for AGIs $75k-100k, 0.9% for AGIs $100k-200k, 0.4% for AGIs over 200k)
Ordinary dividends: $5,607 (reported on 14.4% of returns)
Here:
$5,607
State:
$9,721
(% of AGI for various income ranges: 2.0% for AGIs below $25k, 1.3% for AGIs $50k-75k, 4.8% for AGIs $100k-200k)
Net capital gain/loss in AGI: +$5,062 (reported on 12.5% of returns)
Here:
+$5,062
State:
+$35,319
(% of AGI for various income ranges: 1.2% for AGIs below $25k, 0.4% for AGIs $50k-75k, 4.3% for AGIs $100k-200k)
Profit/loss from business: +$14,826 (reported on 18.3% of returns)
Here:
+$14,826
State:
+$13,732
(% of AGI for various income ranges: 7.9% for AGIs below $25k, 3.3% for AGIs $25k-50k, 5.2% for AGIs $50k-75k, 12.7% for AGIs $100k-200k)
Taxable individual retirement arrangement distribution: $19,158 (reported on 11.5% of returns)
75770:
$19,158
Texas:
$19,511
(% of AGI for various income ranges: 3.0% for AGIs below $25k, 3.9% for AGIs $25k-50k, 6.5% for AGIs $50k-75k, 9.5% for AGIs $100k-200k)
Total itemized deductions: $21,435 (19% of AGI, reported on 25.0% of returns)
Here:
$21,435
State:
$24,724
Here:
19.1% of AGI
State:
15.9% of AGI
(% of AGI for various income ranges: 8.0% for AGIs below $25k, 8.2% for AGIs $25k-50k, 12.4% for AGIs $50k-75k, 14.7% for AGIs $75k-100k, 10.5% for AGIs $100k-200k, 6.3% for AGIs over 200k)
Charity contributions: $5,844 (reported on 17.3% of returns)
Here:
$5,844
State:
$6,808
(% of AGI for various income ranges: 1.9% for AGIs $25k-50k, 2.5% for AGIs $50k-75k, 2.2% for AGIs $75k-100k, 1.8% for AGIs $100k-200k, 1.9% for AGIs over 200k)
Taxes paid: $4,969 (reported on 25.0% of returns)
75770:
$4,969
State:
$6,921
(% of AGI for various income ranges: 1.7% for AGIs below $25k, 1.4% for AGIs $25k-50k, 2.3% for AGIs $50k-75k, 2.7% for AGIs $75k-100k, 2.8% for AGIs $100k-200k, 2.2% for AGIs over 200k)
Earned income credit: $2,222 (reported on 26.0% of returns)
Here:
$2,222
State:
$2,570
(% of AGI for various income ranges: 8.0% for AGIs below $25k, 1.7% for AGIs $25k-50k)
Percentage of individuals using paid preparers for their 2012 taxes: 65.4%
Here:
65%
State:
51%
(% for various income ranges: 60.5% for AGIs below $25k, 65.4% for AGIs $25k-50k, 69.2% for AGIs $50k-75k, 66.7% for AGIs $75k-100k, 70.0% for AGIs $100k-200k, 100.0% for AGIs over 200k)
Averages for the 2004 tax year for zip code 75770, filed in 2005:
Average Adjusted Gross Income (AGI) in 2004: $32,531 (Individual Income Tax Returns)
Here:
$32,531
State:
$47,881
Salary/wage: $31,309 (reported on 81.5% of returns)
Here:
$31,309
State:
$41,947
(% of AGI for various income ranges: 117.2% for AGIs below $10k, 71.9% for AGIs $10k-25k, 83.9% for AGIs $25k-50k, 88.3% for AGIs $50k-75k, 65.9% for AGIs $75k-100k, 65.8% for AGIs over 100k)
Taxable interest for individuals: $1,715 (reported on 31.2% of returns)
This zip code:
$1,715
Texas:
$2,255
(% of AGI for various income ranges: 6.4% for AGIs below $10k, 2.4% for AGIs $10k-25k, 0.9% for AGIs $25k-50k, 1.4% for AGIs $50k-75k, 1.1% for AGIs $75k-100k, 2.3% for AGIs over 100k)
Taxable dividends: $1,613 (reported on 12.8% of returns)
Here:
$1,613
State:
$4,261
(% of AGI for various income ranges: 0.6% for AGIs below $10k, 0.5% for AGIs $10k-25k, 0.5% for AGIs $25k-50k, 0.5% for AGIs $50k-75k, 1.6% for AGIs over 100k)
Net capital gain/loss: +$4,244 (reported on 13.6% of returns)
Here:
+$4,244
State:
+$16,110
(% of AGI for various income ranges: 1.7% for AGIs below $10k, 0.9% for AGIs $10k-25k, 0.7% for AGIs $25k-50k, 0.6% for AGIs $50k-75k, 5.2% for AGIs $75k-100k, 3.6% for AGIs over 100k)
Profit/loss from business: +$5,108 (reported on 17.9% of returns)
Here:
+$5,108
State:
+$11,013
(% of AGI for various income ranges: -0.5% for AGIs below $10k, 9.3% for AGIs $10k-25k, -0.3% for AGIs $25k-50k, 3.0% for AGIs $50k-75k, 5.5% for AGIs $75k-100k)
IRA payment deduction: $2,650 (reported on 2.1% of returns)
75770:
$2,650
Texas:
$3,120
Total itemized deductions: $15,578 (26% of AGI, reported on 20.6% of returns)
Here:
$15,578
State:
$19,631
Here:
26.1% of AGI
State:
18.9% of AGI
(% of AGI for various income ranges: 6.4% for AGIs $10k-25k, 9.7% for AGIs $25k-50k, 12.8% for AGIs $50k-75k, 12.8% for AGIs $75k-100k, 8.4% for AGIs over 100k)
Charity contributions deductions: $3,898 (6% of AGI, reported on 17.9% of returns)
Here:
$3,898
State:
$4,753
Here:
6.3% of AGI
State:
4.2% of AGI
(% of AGI for various income ranges: 1.0% for AGIs $10k-25k, 1.9% for AGIs $25k-50k, 2.4% for AGIs $50k-75k, 2.7% for AGIs $75k-100k, 3.2% for AGIs over 100k)
Total tax: $4,226 (reported on 66.0% of returns)
75770:
$4,226
State:
$9,058
(% of AGI for various income ranges: 4.1% for AGIs below $10k, 3.2% for AGIs $10k-25k, 5.7% for AGIs $25k-50k, 8.8% for AGIs $50k-75k, 11.0% for AGIs $75k-100k, 17.4% for AGIs over 100k)
Earned income credit: $2,016 (reported on 26.9% of returns)
Here:
$2,016
State:
$2,024
Percentage of individuals using paid preparers for their 2004 taxes: 72.1%
Here:
72%
State:
57%
(% for various income ranges: 65.0% for AGIs below $10k, 76.5% for AGIs $10k-25k, 68.7% for AGIs $25k-50k, 75.0% for AGIs $50k-75k, 87.0% for AGIs $75k-100k, 70.6% for AGIs over 100k)
Household received Food Stamps/SNAP in the past 12 months: 78 Household did not receive Food Stamps/SNAP in the past 12 months: 1,003
Women who had a birth in the past 12 months: 35 (32 now married, 2 unmarried) Women who did not have a birth in the past 12 months: 501 (283 now married, 215 unmarried)
Housing units in zip code 75770 with a mortgage: 428 Median monthly owner costs for units with a mortgage: $1,404 Median monthly owner costs for units without a mortgage: $517
Residents with income below the poverty level in 2022:
This zip code:
4.5%
Whole state:
14.0%
Residents with income below 50% of the poverty level in 2022:
This zip code:
1.7%
Whole state:
7.4%
Median number of rooms in houses and condos:
Here:
5.7
State:
6.3
Median number of rooms in apartments:
Here:
4.9
State:
4.0
Notable locations in this zip code not listed on our city pages
Notable locations in zip code 75770: Poynor Volunteer Fire Department (A), Baxter Volunteer Fire Department (B), Larue - New York Volunteer Fire Department (C), Larue - New York Volunteer Fire Department Substation (D), Central Community Center (E). Display/hide their locations on the map
Churches in zip code 75770 include: Rock Hill Church (A), New York Baptist Church (B), Lonestar Baptist Church (C), Larue Baptist Church (D), Union Station African Methodist Episcopal Church (E), Lone Star Church (F). Display/hide their locations on the map
Cemeteries: Alligator Cemetery (1), Bethel Cemetery (2), Myrtle Springs Cemetery (3), Poynor Cemetery (4), New York Cemetery (5). Display/hide their locations on the map
Lakes and reservoirs: Anderson Marsh (A), Pharris Lakes (B), Steele Lakes (C), Farmer Lake (D), Hume Lake (E), Harris Lake (F), Rainbo Lake (G), Grass Lake (H). Display/hide their locations on the map
Streams, rivers, and creeks: Boggy Creek (A), Tonyard Creek (B), Tindel Creek (C), Pierce Creek (D), Palmer Branch (E), New York Creek (F), Mulberry Branch (G), Mill Branch (H), Maggie Creek (I). Display/hide their locations on the map
Size of family households: 451 2-persons, 213 3-persons, 127 4-persons, 19 5-persons, 2 6-persons
Size of nonfamily households: 194 1-person, 80 2-persons
276 married couples with children.
30 single-parent households (9 men, 21 women).
97.2% of residents of 75770 zip code speak English at home.
0.7% of residents speak Spanish at home (100% very well).
0.7% of residents speak other Indo-European language at home (100% very well).
1.6% of residents speak Asian or Pacific Island language at home (100% very well).
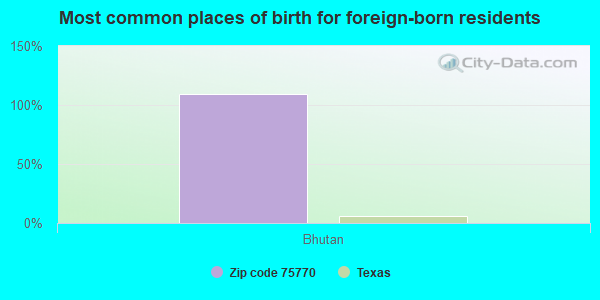
Foreign born population: 37 (1.4%) (100.0% of them are naturalized citizens)
This zip code:
1.4%
Whole state:
17.2%
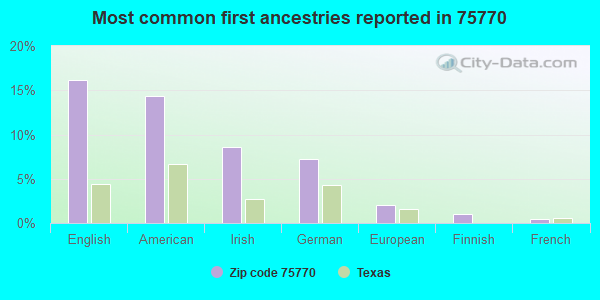
109%Bhutan
16%English
14%American
9%Irish
7%German
2%European
1%Finnish
1%French
Year of entry for the foreign-born population
02010 or later
02000 to 2009
01990 to 1999
31Before 1990
Facilities with environmental interests located in this zip code:
A L P H A CAMPUS (13155 HWY 175 E in LARUE, TX)
(National Center for Education Statistics) - STATE ID-107910002 Organizations: LAPOYNOR ISD (SCHOOL DISTRICT)
Housing units lacking complete plumbing facilities: 3.7% Housing units lacking complete kitchen facilities: 3.7%
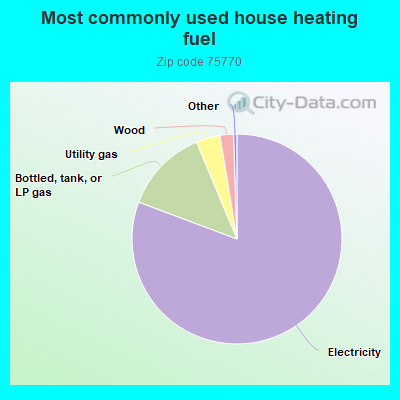
80.8%Electricity
13.0%Bottled, tank, or LP gas
3.7%Utility gas
2.1%Wood
Population in 1990: 2,826.
Place of birth for U.S.-born residents:
This state: 2,092
Northeast: 30
Midwest: 76
South: 283
West: 88
71% of the 75770 zip code residents lived in the same house 5 years ago. Out of people who lived in different houses, 32% lived in this county. Out of people who lived in different counties, 50% lived in Texas.
91% of the 75770 zip code residents lived in the same house 1 year ago. Out of people who lived in different houses, 8% moved from this county. Out of people who lived in different houses, 67% moved from different county within same state. Out of people who lived in different houses, 29% moved from different state. Out of people who lived in different houses, 4% moved from abroad.
Private vs. public school enrollment:
Students in private schools in grades 1 to 8 (elementary and middle school): 6
Here:
3.6%
Texas:
8.8%
Students in private schools in grades 9 to 12 (high school): 7
Here:
8.6%
Texas:
8.0%
Students in private undergraduate colleges:
Here:
0.0%
Texas:
16.2%
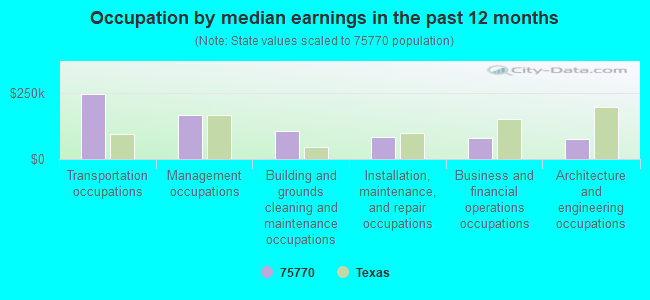
Occupation by median earnings in the past 12 months ($)
248,974Transportation occupations
166,508Management occupations
104,928Building and grounds cleaning and maintenance occupations
82,941Installation, maintenance, and repair occupations
81,238Business and financial operations occupations
74,481Architecture and engineering occupations
Top industries in this zip code by the number of employees in 2005:
Construction: Poured Concrete Foundation and Structure Contractors (10-19 employees: 2 establishments, 5-9 employees: 1 establishment)
Other Services (except Public Administration): Commercial and Industrial Machinery and Equipment (except Automotive and Electronic) Repair and Maintenance (10-19: 1)
Other Services (except Public Administration): Religious Organizations (1-4: 2)
Real Estate and Rental and Leasing: Lessors of Miniwarehouses and Self-Storage Units (1-4: 1)
Arts, Entertainment, and Recreation: Golf Courses and Country Clubs (1-4: 1)
Administrative and Support and Waste Management and Remediation Services: Investigation Services (1-4: 1)
Fatal accident statistics in 2013:
Fatal accident count: 1
Vehicles involved in fatal accidents: 3
Fatal accidents caused by drunken drivers: 0
Fatalities: 2
Persons involved in fatal accidents: 7
Pedestrians involved in fatal accidents: 0
Fatal accident statistics in 2012:
Fatal accident count: 1
Vehicles involved in fatal accidents: 1
Fatal accidents caused by drunken drivers: 1
Fatalities: 1
Persons involved in fatal accidents: 1
Pedestrians involved in fatal accidents: 0
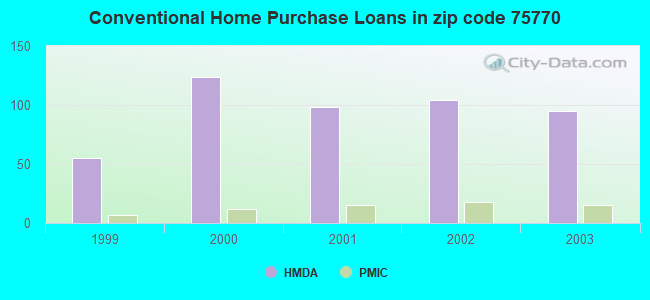
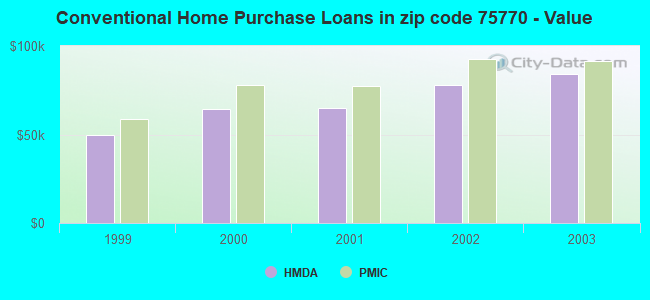
Home Mortgage Disclosure Act Aggregated Statistics For Year 2003 (Based on 2 partial tracts)
A) FHA, FSA/RHS & VA Home Purchase Loans
B) Conventional Home Purchase Loans
C) Refinancings
D) Home Improvement Loans
F) Non-occupant Loans on < 5 Family Dwellings (A B C & D)
Number
Average Value
Number
Average Value
Number
Average Value
Number
Average Value
Number
Average Value
LOANS ORIGINATED
11
$83,709
95
$84,012
115
$92,470
13
$42,215
34
$72,284
APPLICATIONS APPROVED, NOT ACCEPTED
3
$22,867
8
$45,348
22
$81,850
1
$26,380
3
$56,727
APPLICATIONS DENIED
4
$72,885
62
$47,810
109
$74,008
18
$24,039
13
$39,678
APPLICATIONS WITHDRAWN
3
$62,883
13
$83,922
55
$83,709
3
$47,490
7
$50,507
FILES CLOSED FOR INCOMPLETENESS
0
$0
3
$348,710
4
$135,878
0
$0
0
$0
Aggregated Statistics For Year 2002 (Based on 2 partial tracts)
A) FHA, FSA/RHS & VA Home Purchase Loans
B) Conventional Home Purchase Loans
C) Refinancings
D) Home Improvement Loans
F) Non-occupant Loans on < 5 Family Dwellings (A B C & D)
Number
Average Value
Number
Average Value
Number
Average Value
Number
Average Value
Number
Average Value
LOANS ORIGINATED
17
$70,694
104
$77,947
80
$86,935
22
$29,382
33
$91,784
APPLICATIONS APPROVED, NOT ACCEPTED
4
$61,342
22
$55,166
15
$83,197
1
$15,830
1
$29,020
APPLICATIONS DENIED
1
$87,070
74
$49,416
75
$55,934
24
$8,300
11
$63,202
APPLICATIONS WITHDRAWN
0
$0
7
$66,903
42
$95,862
1
$137,200
1
$31,660
FILES CLOSED FOR INCOMPLETENESS
0
$0
3
$57,167
5
$107,910
0
$0
1
$105,540
Aggregated Statistics For Year 2001 (Based on 2 partial tracts)
A) FHA, FSA/RHS & VA Home Purchase Loans
B) Conventional Home Purchase Loans
C) Refinancings
D) Home Improvement Loans
F) Non-occupant Loans on < 5 Family Dwellings (A B C & D)
Number
Average Value
Number
Average Value
Number
Average Value
Number
Average Value
Number
Average Value
LOANS ORIGINATED
12
$64,201
98
$64,829
78
$72,810
16
$30,342
20
$77,042
APPLICATIONS APPROVED, NOT ACCEPTED
0
$0
57
$46,010
15
$46,348
1
$19,790
5
$41,686
APPLICATIONS DENIED
0
$0
108
$45,781
41
$50,323
8
$20,612
13
$40,489
APPLICATIONS WITHDRAWN
3
$54,087
12
$55,956
34
$79,928
1
$19,790
0
$0
FILES CLOSED FOR INCOMPLETENESS
0
$0
1
$39,580
7
$84,806
0
$0
0
$0
Aggregated Statistics For Year 2000 (Based on 2 partial tracts)
A) FHA, FSA/RHS & VA Home Purchase Loans
B) Conventional Home Purchase Loans
C) Refinancings
D) Home Improvement Loans
F) Non-occupant Loans on < 5 Family Dwellings (A B C & D)
Number
Average Value
Number
Average Value
Number
Average Value
Number
Average Value
Number
Average Value
LOANS ORIGINATED
8
$47,491
124
$64,290
24
$58,705
25
$15,672
29
$45,990
APPLICATIONS APPROVED, NOT ACCEPTED
0
$0
36
$54,564
7
$40,519
8
$18,964
1
$145,110
APPLICATIONS DENIED
4
$36,608
127
$41,342
41
$56,983
25
$11,714
7
$37,503
APPLICATIONS WITHDRAWN
0
$0
13
$77,528
7
$70,671
3
$25,943
0
$0
FILES CLOSED FOR INCOMPLETENESS
0
$0
1
$52,770
3
$38,697
0
$0
0
$0
Aggregated Statistics For Year 1999 (Based on 1 partial tract)
A) FHA, FSA/RHS & VA Home Purchase Loans
B) Conventional Home Purchase Loans
C) Refinancings
D) Home Improvement Loans
F) Non-occupant Loans on < 5 Family Dwellings (A B C & D)
Detailed PMIC statistics for the following Tracts:9514.00
2004 - 2018 National Fire Incident Reporting System (NFIRS) incidents
According to the data from the years 2004 - 2018 the average number of fire incidents per year is 40. The highest number of fires - 67 took place in 2005, and the least - 24 in 2016. The data has a dropping trend.
When looking into fire subcategories, the most reports belonged to: Outside Fires (71.2%), and Structure Fires (19.9%).
Fire incident types reported to NFIRS in Zip Code 75770

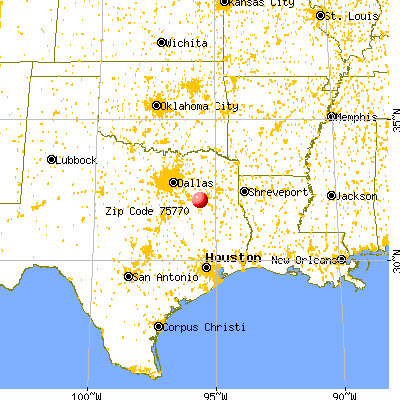


 Nearest zip codes: 75756, 75778, 75758, 75763, 75752, 75762.


 According to the data from the years 2004 - 2018 the average number of fire incidents per year is 40. The highest number of fires - 67 took place in 2005, and the least - 24 in 2016. The data has a dropping trend.
 When looking into fire subcategories, the most reports belonged to: Outside Fires (71.2%), and Structure Fires (19.9%).