Estimated zip code population in 2022: 2,537 Zip code population in 2010: 3,254 Zip code population in 2000: 2,807
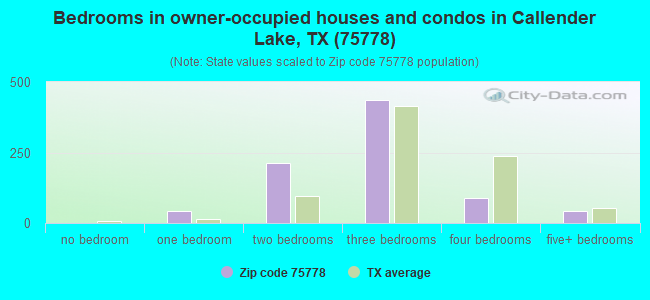
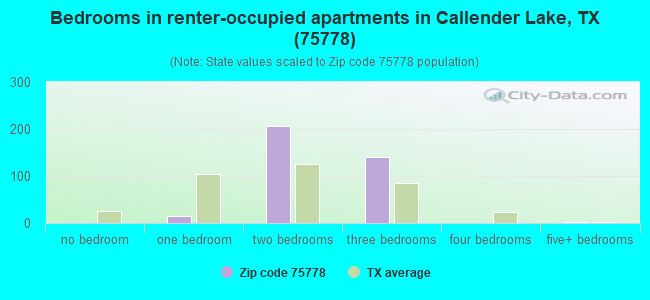
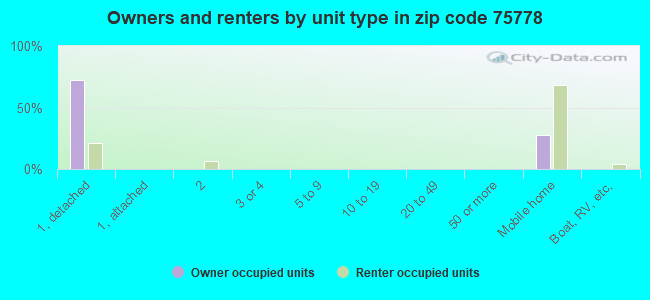
Houses and condos: 1,652 Renter-occupied apartments: 374
% of renters here:
31%
State:
38%
March 2022 cost of living index in zip code 75778: 85.5 (less than average, U.S. average is 100)
Land area: 56.3 sq. mi. Water area: 1.1 sq. mi.
Population density: 45 people per square mile
(very low).
OSM Map
General Map
Google Map
MSN Map
OSM Map
General Map
Google Map
MSN Map
OSM Map
General Map
Google Map
MSN Map
OSM Map
General Map
Google Map
MSN Map
Please wait while loading the map...
Real estate property taxes paid for housing units in 2022:
This zip code:
0.7% ($1,171)
Texas:
1.5% ($4,050)
Median real estate property taxes paid for housing units with mortgages in 2022: $1,075 (0.6%) Median real estate property taxes paid for housing units with no mortgage in 2022: $1,273 (0.8%)
Business Search- 14 Million verified businesses
Males: 1,240
(48.9%)
Females: 1,296
(51.1%)
For population 25 years and over in 75778:
High school or higher: 93.8%
Bachelor's degree or higher: 20.0%
Graduate or professional degree: 5.0%
Unemployed: 1.3%
Mean travel time to work (commute): 36.8 minutes
For population 15 years and over in 75778:
Never married: 12.0%
Now married: 63.0%
Separated: 0.8%
Widowed: 14.2%
Divorced: 10.0%
Zip code 75778 compared to state average:
Median household income below state average.
Median house value below state average.
Unemployed percentage significantly below state average.
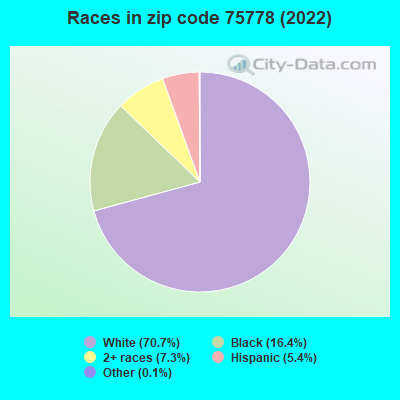
Hispanic race population percentage significantly below state average.
Median age above state average.
Foreign-born population percentage significantly below state average.
Length of stay since moving in significantly above state average.
Number of college students below state average.
Percentage of population with a bachelor's degree or higher below state average.
Averages for the 2020 tax year for zip code 75778, filed in 2021:
Average Adjusted Gross Income (AGI) in 2020: $57,945 (Individual Income Tax Returns)
Here:
$57,945
State:
$77,054
Salary/wage: $46,196 (reported on 75.2% of returns)
Here:
$46,196
State:
$62,766
(% of AGI for various income ranges: 1024.8% for AGIs below $25k, 3275.9% for AGIs $25k-50k, 6617.3% for AGIs $50k-75k, 9123.3% for AGIs $75k-100k, 11980.0% for AGIs $100k-200k)
Taxable interest for individuals: $1,021 (reported on 22.1% of returns)
This zip code:
$1,021
Texas:
$2,665
(% of AGI for various income ranges: 11.0% for AGIs below $25k, 28.1% for AGIs $25k-50k, 19.3% for AGIs $50k-75k, 28.9% for AGIs $75k-100k, 67.0% for AGIs $100k-200k)
Ordinary dividends: $4,200 (reported on 10.1% of returns)
Here:
$4,200
State:
$10,044
(% of AGI for various income ranges: 19.0% for AGIs below $25k, 80.7% for AGIs $50k-75k, 143.3% for AGIs $75k-100k, 300.0% for AGIs $100k-200k)
Net capital gain/loss in AGI: +$11,894 (reported on 10.7% of returns)
Here:
+$11,894
State:
+$39,590
(% of AGI for various income ranges: 27.6% for AGIs below $25k, 136.0% for AGIs $50k-75k, 365.6% for AGIs $75k-100k, 1254.0% for AGIs $100k-200k)
Profit/loss from business: +$7,919 (reported on 20.8% of returns)
Here:
+$7,919
State:
+$10,888
(% of AGI for various income ranges: 201.7% for AGIs below $25k, 157.5% for AGIs $25k-50k, 167.3% for AGIs $50k-75k, 190.0% for AGIs $75k-100k, 682.0% for AGIs $100k-200k)
Taxable individual retirement arrangement distribution: $18,707 (reported on 9.4% of returns)
75778:
$18,707
Texas:
$24,740
(% of AGI for various income ranges: 79.8% for AGIs below $25k, 142.8% for AGIs $25k-50k, 586.7% for AGIs $75k-100k, 1299.0% for AGIs $100k-200k)
Total itemized deductions: $42,825 (reported on 2.7% of returns)
Here:
$42,825
State:
$40,428
(% of AGI for various income ranges: 197.5% for AGIs $25k-50k, 1081.0% for AGIs $100k-200k)
Charity contributions: $18,900 (reported on 2.0% of returns)
Here:
$18,900
State:
$18,201
(% of AGI for various income ranges: 567.0% for AGIs $100k-200k)
Taxes paid: $6,125 (reported on 2.7% of returns)
75778:
$6,125
State:
$7,821
(% of AGI for various income ranges: 14.5% for AGIs below $25k, 184.0% for AGIs $100k-200k)
Earned income credit: $2,534 (reported on 21.5% of returns)
Here:
$2,534
State:
$2,584
(% of AGI for various income ranges: 127.6% for AGIs below $25k, 85.9% for AGIs $25k-50k)
Percentage of individuals using paid preparers for their 2020 taxes: 96.0%
Here:
96%
State:
92%
(% for various income ranges: 94.8% for AGIs below $25k, 97.4% for AGIs $25k-50k, 95.2% for AGIs $50k-75k, 100.0% for AGIs $75k-100k, 92.9% for AGIs $100k-200k, 100.0% for AGIs over 200k)
Averages for the 2012 tax year for zip code 75778, filed in 2013:
Average Adjusted Gross Income (AGI) in 2012: $41,487 (Individual Income Tax Returns)
Here:
$41,487
State:
$65,384
Salary/wage: $39,474 (reported on 74.6% of returns)
Here:
$39,474
State:
$52,524
(% of AGI for various income ranges: 64.1% for AGIs below $25k, 74.5% for AGIs $25k-50k, 76.1% for AGIs $50k-75k, 71.1% for AGIs $75k-100k, 67.2% for AGIs $100k-200k)
Taxable interest for individuals: $858 (reported on 26.2% of returns)
This zip code:
$858
Texas:
$2,372
(% of AGI for various income ranges: 1.5% for AGIs below $25k, 0.4% for AGIs $25k-50k, 0.3% for AGIs $50k-75k, 0.3% for AGIs $75k-100k, 0.5% for AGIs $100k-200k)
Ordinary dividends: $3,067 (reported on 11.9% of returns)
Here:
$3,067
State:
$9,721
(% of AGI for various income ranges: 2.2% for AGIs below $25k, 0.3% for AGIs $25k-50k, 1.7% for AGIs $50k-75k, 0.5% for AGIs $100k-200k)
Net capital gain/loss in AGI: +$800 (reported on 8.7% of returns)
Here:
+$800
State:
+$35,319
(% of AGI for various income ranges: 0.2% for AGIs $50k-75k, 0.7% for AGIs $100k-200k)
Profit/loss from business: +$8,628 (reported on 19.8% of returns)
Here:
+$8,628
State:
+$13,732
(% of AGI for various income ranges: 10.1% for AGIs below $25k, 3.4% for AGIs $25k-50k, 2.1% for AGIs $50k-75k, 3.7% for AGIs $75k-100k, 3.7% for AGIs $100k-200k)
Taxable individual retirement arrangement distribution: $13,486 (reported on 11.1% of returns)
75778:
$13,486
Texas:
$19,511
(% of AGI for various income ranges: 3.8% for AGIs below $25k, 3.6% for AGIs $25k-50k, 3.4% for AGIs $50k-75k, 10.0% for AGIs $75k-100k)
Total itemized deductions: $19,414 (25% of AGI, reported on 16.7% of returns)
Here:
$19,414
State:
$24,724
Here:
24.9% of AGI
State:
15.9% of AGI
(% of AGI for various income ranges: 5.7% for AGIs below $25k, 7.2% for AGIs $25k-50k, 9.5% for AGIs $50k-75k, 5.4% for AGIs $75k-100k, 9.4% for AGIs $100k-200k)
Charity contributions: $5,800 (reported on 11.1% of returns)
Here:
$5,800
State:
$6,808
(% of AGI for various income ranges: 1.5% for AGIs $25k-50k, 1.8% for AGIs $50k-75k, 3.1% for AGIs $100k-200k)
Taxes paid: $3,338 (reported on 16.7% of returns)
75778:
$3,338
State:
$6,921
(% of AGI for various income ranges: 0.9% for AGIs below $25k, 1.0% for AGIs $25k-50k, 1.4% for AGIs $50k-75k, 1.3% for AGIs $75k-100k, 1.8% for AGIs $100k-200k)
Earned income credit: $2,245 (reported on 23.0% of returns)
Here:
$2,245
State:
$2,570
(% of AGI for various income ranges: 6.7% for AGIs below $25k, 1.5% for AGIs $25k-50k)
Percentage of individuals using paid preparers for their 2012 taxes: 55.6%
Here:
56%
State:
51%
(% for various income ranges: 53.6% for AGIs below $25k, 54.5% for AGIs $25k-50k, 63.2% for AGIs $50k-75k, 55.6% for AGIs $75k-100k, 55.6% for AGIs $100k-200k)
Averages for the 2004 tax year for zip code 75778, filed in 2005:
Average Adjusted Gross Income (AGI) in 2004: $32,592 (Individual Income Tax Returns)
Here:
$32,592
State:
$47,881
Salary/wage: $30,558 (reported on 77.3% of returns)
Here:
$30,558
State:
$41,947
(% of AGI for various income ranges: 83.2% for AGIs below $10k, 68.3% for AGIs $10k-25k, 77.8% for AGIs $25k-50k, 76.6% for AGIs $50k-75k, 75.0% for AGIs $75k-100k, 47.5% for AGIs over 100k)
Taxable interest for individuals: $1,535 (reported on 33.6% of returns)
This zip code:
$1,535
Texas:
$2,255
(% of AGI for various income ranges: 11.4% for AGIs below $10k, 2.5% for AGIs $10k-25k, 1.2% for AGIs $25k-50k, 0.5% for AGIs $50k-75k, 0.8% for AGIs $75k-100k, 3.0% for AGIs over 100k)
Taxable dividends: $1,125 (reported on 14.0% of returns)
Here:
$1,125
State:
$4,261
(% of AGI for various income ranges: 2.4% for AGIs below $10k, 0.8% for AGIs $10k-25k, 0.4% for AGIs $25k-50k, 0.4% for AGIs $50k-75k, 0.0% for AGIs $75k-100k, 0.7% for AGIs over 100k)
Net capital gain/loss: +$4,713 (reported on 11.4% of returns)
Here:
+$4,713
State:
+$16,110
(% of AGI for various income ranges: 1.5% for AGIs below $10k, 1.2% for AGIs $10k-25k, 0.3% for AGIs $25k-50k, 1.0% for AGIs $50k-75k, 0.2% for AGIs $75k-100k, 9.2% for AGIs over 100k)
Profit/loss from business: +$6,479 (reported on 20.1% of returns)
Here:
+$6,479
State:
+$11,013
(% of AGI for various income ranges: 20.8% for AGIs below $10k, 7.9% for AGIs $10k-25k, 2.2% for AGIs $25k-50k, 0.6% for AGIs $50k-75k, 10.9% for AGIs $75k-100k)
IRA payment deduction: $2,857 (reported on 1.2% of returns)
75778:
$2,857
Texas:
$3,120
Total itemized deductions: $16,634 (28% of AGI, reported on 14.4% of returns)
Here:
$16,634
State:
$19,631
Here:
28.5% of AGI
State:
18.9% of AGI
(% of AGI for various income ranges: 7.9% for AGIs $10k-25k, 6.2% for AGIs $25k-50k, 8.4% for AGIs $50k-75k, 7.0% for AGIs $75k-100k, 8.8% for AGIs over 100k)
Charity contributions deductions: $3,380 (6% of AGI, reported on 11.5% of returns)
Here:
$3,380
State:
$4,753
Here:
5.8% of AGI
State:
4.2% of AGI
(% of AGI for various income ranges: 0.6% for AGIs $10k-25k, 0.9% for AGIs $25k-50k, 1.4% for AGIs $50k-75k, 1.4% for AGIs $75k-100k, 2.4% for AGIs over 100k)
Total tax: $3,923 (reported on 70.2% of returns)
75778:
$3,923
State:
$9,058
(% of AGI for various income ranges: 4.4% for AGIs below $10k, 3.8% for AGIs $10k-25k, 6.1% for AGIs $25k-50k, 8.5% for AGIs $50k-75k, 11.8% for AGIs $75k-100k, 17.5% for AGIs over 100k)
Earned income credit: $1,876 (reported on 22.3% of returns)
Here:
$1,876
State:
$2,024
Percentage of individuals using paid preparers for their 2004 taxes: 62.1%
Here:
62%
State:
57%
(% for various income ranges: 55.2% for AGIs below $10k, 64.3% for AGIs $10k-25k, 61.7% for AGIs $25k-50k, 64.2% for AGIs $50k-75k, 67.7% for AGIs $75k-100k, 79.3% for AGIs over 100k)
Likely homosexual households (counted as self-reported same-sex unmarried-partner households)
Lesbian couples: 0.0% of all households
Gay men: 0.2% of all households
Household received Food Stamps/SNAP in the past 12 months: 94 Household did not receive Food Stamps/SNAP in the past 12 months: 1,104
Women who had a birth in the past 12 months: 135 (138 now married, 0 unmarried) Women who did not have a birth in the past 12 months: 324 (199 now married, 124 unmarried)
Housing units in zip code 75778 with a mortgage: 334 (1 second mortgage, 2 both second mortgage and home equity loan) Houses without a mortgage: 48
Median monthly owner costs for units with a mortgage: $1,228 Median monthly owner costs for units without a mortgage: $442
Residents with income below the poverty level in 2022:
This zip code:
8.4%
Whole state:
14.0%
Residents with income below 50% of the poverty level in 2022:
This zip code:
5.6%
Whole state:
7.4%
Median number of rooms in houses and condos:
Here:
5.5
State:
6.3
Median number of rooms in apartments:
Here:
4.9
State:
4.0
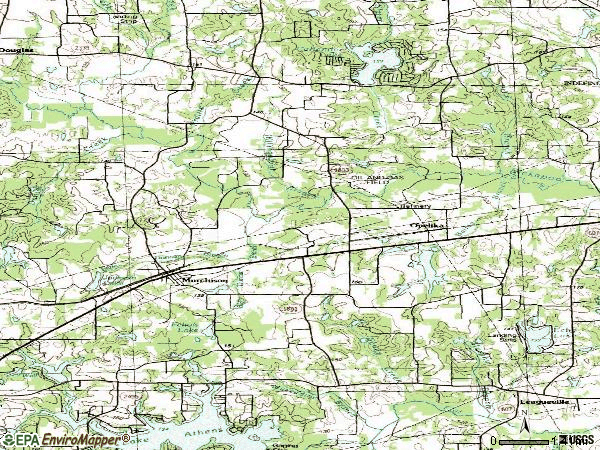
Notable locations in this zip code not listed on our city pages
Lakes and reservoirs: Raines Lake (A), Gileon Lake (B), Waldrip Lake (C), Jackson Lake (D), Scott Marsh (E), Arms Lake (F), Harten Slough (G), Callender Lake (H). Display/hide their locations on the map
Streams, rivers, and creeks: Bailey Branch (A), Muscadine Branch (B), Sandy Creek (C), Slater Creek (D), Murphy Branch (E), Cream Level Creek (F), Daniel Creek (G), Reed Branch (H), Prairie Creek (I). Display/hide their locations on the map
Size of family households: 296 2-persons, 268 3-persons, 48 4-persons, 43 5-persons, 41 6-persons
Size of nonfamily households: 471 1-person, 35 2-persons, 3 3-persons
455 married couples with children.
47 single-parent households (6 men, 41 women).
96.9% of residents of 75778 zip code speak English at home.
3.4% of residents speak Spanish at home (53% very well, 30% well, 17% not at all).
0.3% of residents speak other Indo-European language at home (100% well).
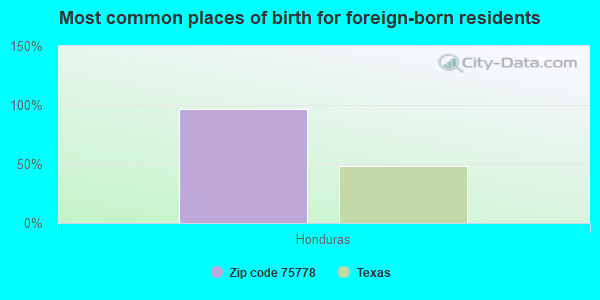
Foreign born population: 53 (2.1%) (24.6% of them are naturalized citizens)
This zip code:
2.1%
Whole state:
17.2%
96%Honduras
24%American
15%English
5%German
3%Irish
3%Scottish
1%British
1%Polish
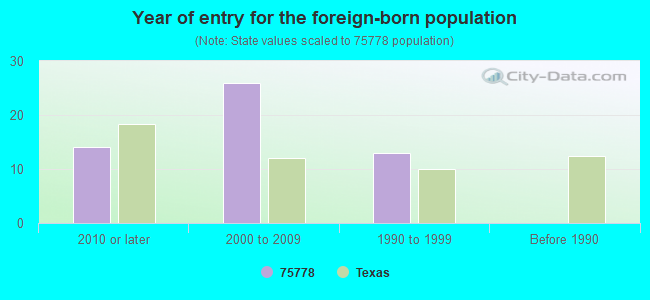
Year of entry for the foreign-born population
142010 or later
262000 to 2009
131990 to 1999
0Before 1990
Housing units lacking complete plumbing facilities: 1.2% Housing units lacking complete kitchen facilities: 2.8%
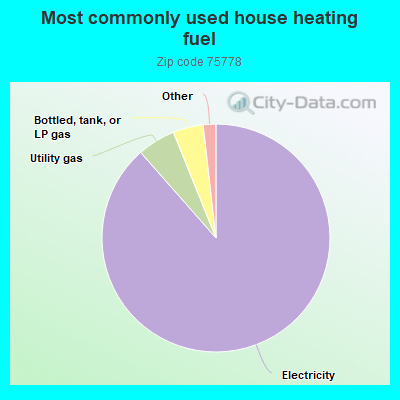
88.7%Electricity
5.4%Utility gas
4.3%Bottled, tank, or LP gas
1.0%No fuel used
0.7%Solar energy
Population in 1990: 1,801. Population change in the 1990s: +1,006 (+55.9%).
Place of birth for U.S.-born residents:
This state: 2,057
Northeast: 64
Midwest: 73
South: 196
West: 69
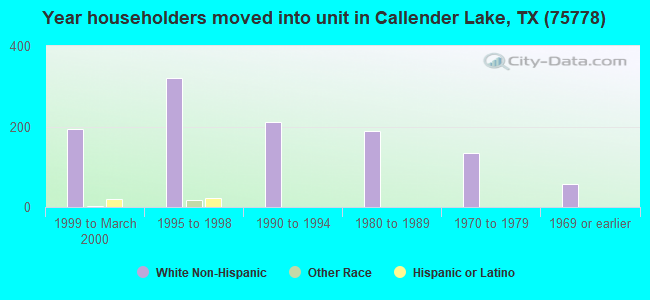
55% of the 75778 zip code residents lived in the same house 5 years ago. Out of people who lived in different houses, 26% lived in this county. Out of people who lived in different counties, 50% lived in Texas.
80% of the 75778 zip code residents lived in the same house 1 year ago. Out of people who lived in different houses, 21% moved from this county. Out of people who lived in different houses, 64% moved from different county within same state. Out of people who lived in different houses, 18% moved from different state.
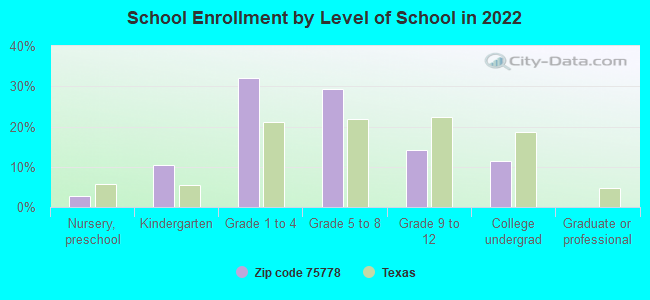
Private vs. public school enrollment:
Students in private schools in grades 1 to 8 (elementary and middle school): 76
Here:
29.6%
Texas:
8.8%
Students in private schools in grades 9 to 12 (high school): 3
Here:
5.5%
Texas:
8.0%
Students in private undergraduate colleges:
Here:
0.0%
Texas:
16.2%
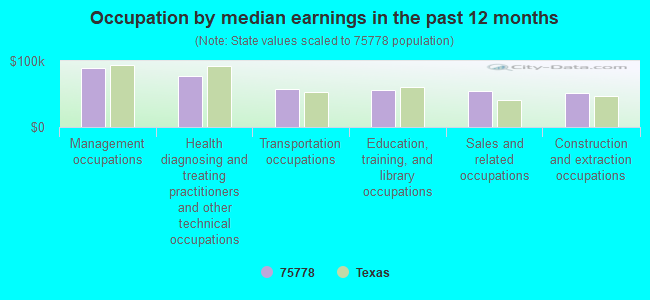
Occupation by median earnings in the past 12 months ($)
89,021Management occupations
76,989Health diagnosing and treating practitioners and other technical occupations
58,093Transportation occupations
55,934Education, training, and library occupations
54,568Sales and related occupations
50,985Construction and extraction occupations
Companies with federal contracts located in this zip code:
MARLER, MAGDA (10101 STATE HWY 31 EAST in MURCHISON, TX; small business) : $29,634 in 6 contractsfrom 2005 to 2006
Contracts for Operation of Government-Owned Facilities -- Recreation Facilities (Non-Building) by Army, U.S. Army Corps of Engineers - civil program financing only Signed by year:2000: $0; 2001: $0; 2002: $0; 2003: $0; 2004: $0; 2005: $20,034; 2006: $9,600.
Biggest contracts:
$9,600 with Army for Operation of Government-Owned Facilities -- Recreation Facilities (Non-Building). Taking place in AR. Signed on 2006-02-28. Completion date: 2005-09-30.
$9,198 with U.S. Army Corps of Engineers - civil program financing only for Operation of Government-Owned Facilities -- Recreation Facilities (Non-Building). Taking place in AR. Signed on 2005-03-23. Completion date: 2005-09-30.
$9,198 with Army for Operation of Government-Owned Facilities -- Recreation Facilities (Non-Building). Taking place in AR. Signed on 2005-03-23. Completion date: 2005-09-30.
$1,386, same as above.Signed on 2005-10-19. Completion date: 2005-09-30.
MARLER, HOBERT (10101 STATE HWY EAST in MURCHISON, TX; small business) : $15,774 in 4 contractsfrom 2003 to 2004
$8,316 with U.S. Army Corps of Engineers - civil program financing only for Operation of Government-Owned Facilities -- Recreation Facilities (Non-Building). Taking place in AR. Signed on 2003-04-01. Completion date: 2003-09-16.
$7,590 with Army for Operation of Government-Owned Facilities -- Recreation Facilities (Non-Building). Taking place in AR. Signed on 2004-02-04. Completion date: 2003-09-16.
-$66, same as above.Signed on 2004-09-17. Completion date: 2003-09-16.
-$66 with U.S. Army Corps of Engineers - civil program financing only for Operation of Government-Owned Facilities -- Recreation Facilities (Non-Building). Taking place in AR. Signed on 2003-09-18. Completion date: 2003-09-16.
Top industries in this zip code by the number of employees in 2005:
Detailed PMIC statistics for the following Tracts:9502.00
, 9503.00
2003 - 2018 National Fire Incident Reporting System (NFIRS) incidents
According to the data from the years 2003 - 2018 the average number of fires per year is 37. The highest number of fire incidents - 69 took place in 2011, and the least - 9 in 2004. The data has a growing trend.
When looking into fire subcategories, the most incidents belonged to: Outside Fires (67.0%), and Structure Fires (21.0%).
Fire incident types reported to NFIRS in Zip Code 75778

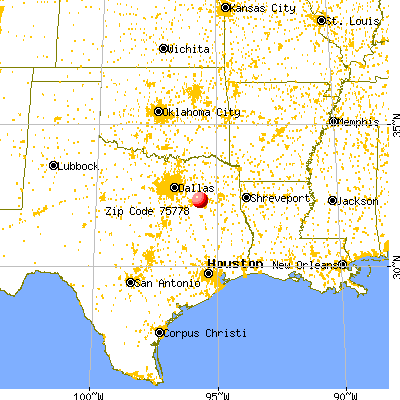


 Nearest zip codes: 75756, 75752, 75754, 75770, 75758, 75790.
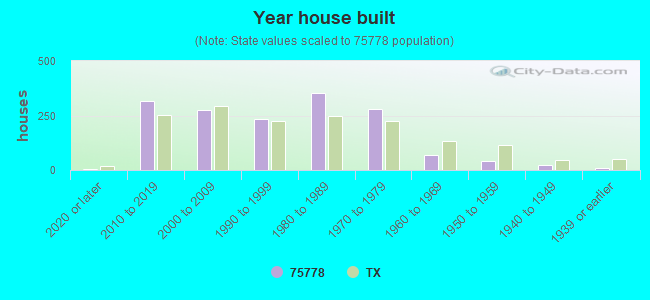


 : $29,634 in 6 contracts from 2005 to 2006

 According to the data from the years 2003 - 2018 the average number of fires per year is 37. The highest number of fire incidents - 69 took place in 2011, and the least - 9 in 2004. The data has a growing trend.
 When looking into fire subcategories, the most incidents belonged to: Outside Fires (67.0%), and Structure Fires (21.0%).