Estimated zip code population in 2022: 9,376 Zip code population in 2010: 9,072 Zip code population in 2000: 7,925
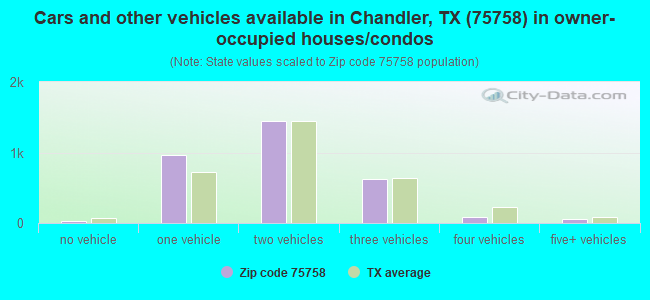
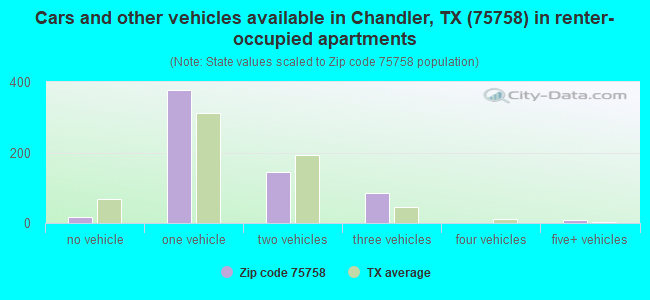
Houses and condos: 4,791 Renter-occupied apartments: 630
% of renters here:
16%
State:
38%
March 2022 cost of living index in zip code 75758: 83.8 (less than average, U.S. average is 100)
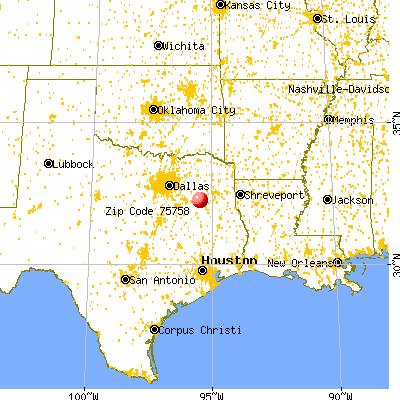
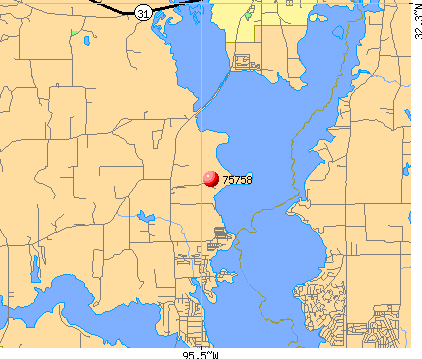
Land area: 49.4 sq. mi. Water area: 17.9 sq. mi.
Population density: 190 people per square mile
(very low).
OSM Map
General Map
Google Map
MSN Map
OSM Map
General Map
Google Map
MSN Map
OSM Map
General Map
Google Map
MSN Map
OSM Map
General Map
Google Map
MSN Map
Please wait while loading the map...
Real estate property taxes paid for housing units in 2022:
This zip code:
1.0% ($1,436)
Texas:
1.5% ($4,050)
Median real estate property taxes paid for housing units with mortgages in 2022: $2,577 (1.1%) Median real estate property taxes paid for housing units with no mortgage in 2022: $1,143 (1.0%)
Business Search- 14 Million verified businesses
Males: 4,942
(52.7%)
Females: 4,434
(47.3%)
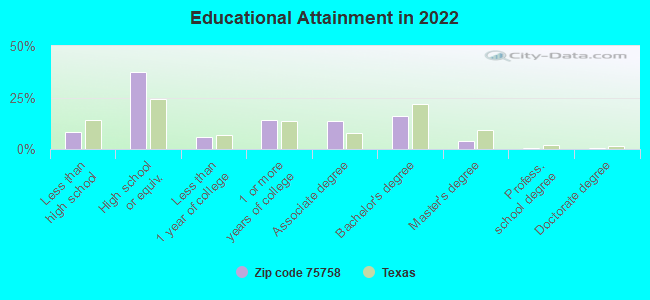
For population 25 years and over in 75758:
High school or higher: 91.4%
Bachelor's degree or higher: 20.6%
Graduate or professional degree: 4.5%
Unemployed: 4.4%
Mean travel time to work (commute): 30.2 minutes
For population 15 years and over in 75758:
Never married: 18.1%
Now married: 59.1%
Separated: 1.3%
Widowed: 9.8%
Divorced: 11.6%
Zip code 75758 compared to state average:
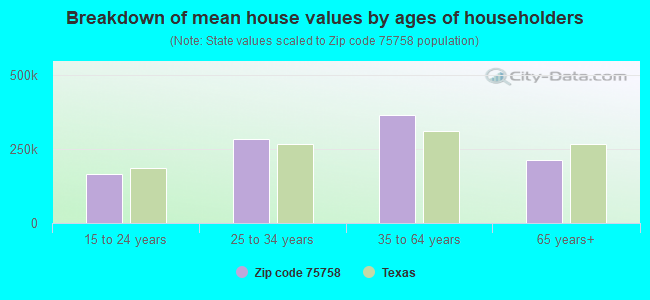
Median house value below state average.
Black race population percentage significantly below state average.
Hispanic race population percentage below state average.
Median age significantly above state average.
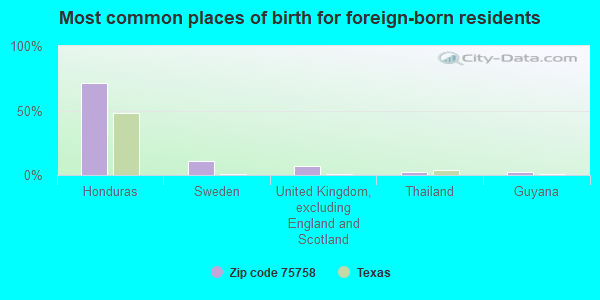
Foreign-born population percentage significantly below state average.
Renting percentage significantly below state average.
Length of stay since moving in significantly above state average.
Averages for the 2020 tax year for zip code 75758, filed in 2021:
Average Adjusted Gross Income (AGI) in 2020: $57,875 (Individual Income Tax Returns)
Here:
$57,875
State:
$77,054
Salary/wage: $50,202 (reported on 77.8% of returns)
Here:
$50,202
State:
$62,766
(% of AGI for various income ranges: 1113.7% for AGIs below $25k, 3271.5% for AGIs $25k-50k, 6369.6% for AGIs $50k-75k, 9025.3% for AGIs $75k-100k, 16036.5% for AGIs $100k-200k, 68343.3% for AGIs over 200k)
Taxable interest for individuals: $1,603 (reported on 26.2% of returns)
This zip code:
$1,603
Texas:
$2,665
(% of AGI for various income ranges: 19.0% for AGIs below $25k, 21.5% for AGIs $25k-50k, 44.5% for AGIs $50k-75k, 54.0% for AGIs $75k-100k, 131.1% for AGIs $100k-200k, 2213.3% for AGIs over 200k)
Ordinary dividends: $5,150 (reported on 13.8% of returns)
Here:
$5,150
State:
$10,044
(% of AGI for various income ranges: 23.3% for AGIs below $25k, 22.7% for AGIs $25k-50k, 78.7% for AGIs $50k-75k, 99.0% for AGIs $75k-100k, 205.7% for AGIs $100k-200k, 4560.0% for AGIs over 200k)
Net capital gain/loss in AGI: +$13,110 (reported on 12.9% of returns)
Here:
+$13,110
State:
+$39,590
(% of AGI for various income ranges: 9.6% for AGIs below $25k, 20.4% for AGIs $25k-50k, 104.3% for AGIs $50k-75k, 192.0% for AGIs $75k-100k, 396.5% for AGIs $100k-200k, 16736.7% for AGIs over 200k)
Profit/loss from business: +$8,556 (reported on 17.4% of returns)
Here:
+$8,556
State:
+$10,888
(% of AGI for various income ranges: 126.3% for AGIs below $25k, 105.9% for AGIs $25k-50k, 177.7% for AGIs $50k-75k, 377.7% for AGIs $75k-100k, 299.2% for AGIs $100k-200k, 4366.7% for AGIs over 200k)
Taxable individual retirement arrangement distribution: $19,376 (reported on 10.5% of returns)
75758:
$19,376
Texas:
$24,740
(% of AGI for various income ranges: 60.7% for AGIs below $25k, 116.4% for AGIs $25k-50k, 216.6% for AGIs $50k-75k, 476.7% for AGIs $75k-100k, 843.0% for AGIs $100k-200k, 6920.0% for AGIs over 200k)
Total itemized deductions: $36,262 (reported on 4.5% of returns)
Here:
$36,262
State:
$40,428
(% of AGI for various income ranges: 125.8% for AGIs $25k-50k, 234.0% for AGIs $50k-75k, 296.7% for AGIs $75k-100k, 566.5% for AGIs $100k-200k, 7736.7% for AGIs over 200k)
Charity contributions: $15,886 (reported on 3.0% of returns)
Here:
$15,886
State:
$18,201
(% of AGI for various income ranges: 17.7% for AGIs $25k-50k, 60.9% for AGIs $50k-75k, 163.2% for AGIs $100k-200k, 3880.0% for AGIs over 200k)
Taxes paid: $5,975 (reported on 4.3% of returns)
75758:
$5,975
State:
$7,821
(% of AGI for various income ranges: 17.8% for AGIs $25k-50k, 39.6% for AGIs $50k-75k, 32.0% for AGIs $75k-100k, 119.2% for AGIs $100k-200k, 1003.3% for AGIs over 200k)
Earned income credit: $2,305 (reported on 18.7% of returns)
Here:
$2,305
State:
$2,584
(% of AGI for various income ranges: 105.7% for AGIs below $25k, 75.6% for AGIs $25k-50k)
Percentage of individuals using paid preparers for their 2020 taxes: 93.3%
Here:
93%
State:
92%
(% for various income ranges: 91.5% for AGIs below $25k, 94.9% for AGIs $25k-50k, 92.6% for AGIs $50k-75k, 95.5% for AGIs $75k-100k, 94.9% for AGIs $100k-200k, 91.7% for AGIs over 200k)
Averages for the 2012 tax year for zip code 75758, filed in 2013:
Average Adjusted Gross Income (AGI) in 2012: $46,834 (Individual Income Tax Returns)
Here:
$46,834
State:
$65,384
Salary/wage: $42,375 (reported on 80.4% of returns)
Here:
$42,375
State:
$52,524
(% of AGI for various income ranges: 69.6% for AGIs below $25k, 76.7% for AGIs $25k-50k, 72.7% for AGIs $50k-75k, 76.1% for AGIs $75k-100k, 77.2% for AGIs $100k-200k, 50.6% for AGIs over 200k)
Taxable interest for individuals: $1,270 (reported on 28.7% of returns)
This zip code:
$1,270
Texas:
$2,372
(% of AGI for various income ranges: 1.4% for AGIs below $25k, 0.7% for AGIs $25k-50k, 0.7% for AGIs $50k-75k, 0.9% for AGIs $75k-100k, 0.5% for AGIs $100k-200k, 0.9% for AGIs over 200k)
Ordinary dividends: $3,292 (reported on 12.1% of returns)
Here:
$3,292
State:
$9,721
(% of AGI for various income ranges: 1.2% for AGIs below $25k, 1.1% for AGIs $25k-50k, 0.7% for AGIs $50k-75k, 0.5% for AGIs $75k-100k, 0.8% for AGIs $100k-200k, 1.0% for AGIs over 200k)
Net capital gain/loss in AGI: +$5,718 (reported on 9.2% of returns)
Here:
+$5,718
State:
+$35,319
(% of AGI for various income ranges: 0.5% for AGIs $50k-75k, 0.7% for AGIs $75k-100k, 1.3% for AGIs $100k-200k, 6.5% for AGIs over 200k)
Profit/loss from business: +$11,704 (reported on 18.6% of returns)
Here:
+$11,704
State:
+$13,732
(% of AGI for various income ranges: 8.5% for AGIs below $25k, 3.0% for AGIs $25k-50k, 3.7% for AGIs $50k-75k, 3.9% for AGIs $75k-100k, 7.3% for AGIs $100k-200k)
Taxable individual retirement arrangement distribution: $13,921 (reported on 10.4% of returns)
75758:
$13,921
Texas:
$19,511
(% of AGI for various income ranges: 3.3% for AGIs below $25k, 3.1% for AGIs $25k-50k, 2.8% for AGIs $50k-75k, 3.5% for AGIs $75k-100k, 4.1% for AGIs $100k-200k)
Total itemized deductions: $20,634 (25% of AGI, reported on 21.7% of returns)
Here:
$20,634
State:
$24,724
Here:
24.8% of AGI
State:
15.9% of AGI
(% of AGI for various income ranges: 9.9% for AGIs below $25k, 8.4% for AGIs $25k-50k, 9.3% for AGIs $50k-75k, 11.1% for AGIs $75k-100k, 10.6% for AGIs $100k-200k, 7.1% for AGIs over 200k)
Charity contributions: $5,719 (reported on 16.7% of returns)
Here:
$5,719
State:
$6,808
(% of AGI for various income ranges: 0.9% for AGIs below $25k, 1.1% for AGIs $25k-50k, 1.7% for AGIs $50k-75k, 2.5% for AGIs $75k-100k, 2.6% for AGIs $100k-200k, 3.6% for AGIs over 200k)
Taxes paid: $4,220 (reported on 21.0% of returns)
75758:
$4,220
State:
$6,921
(% of AGI for various income ranges: 1.3% for AGIs below $25k, 1.4% for AGIs $25k-50k, 1.8% for AGIs $50k-75k, 2.2% for AGIs $75k-100k, 2.5% for AGIs $100k-200k, 1.7% for AGIs over 200k)
Earned income credit: $2,257 (reported on 21.7% of returns)
Here:
$2,257
State:
$2,570
(% of AGI for various income ranges: 7.4% for AGIs below $25k, 1.2% for AGIs $25k-50k)
Percentage of individuals using paid preparers for their 2012 taxes: 55.3%
Here:
55%
State:
51%
(% for various income ranges: 51.8% for AGIs below $25k, 53.7% for AGIs $25k-50k, 61.0% for AGIs $50k-75k, 59.5% for AGIs $75k-100k, 59.5% for AGIs $100k-200k, 80.0% for AGIs over 200k)
Averages for the 2004 tax year for zip code 75758, filed in 2005:
Average Adjusted Gross Income (AGI) in 2004: $37,982 (Individual Income Tax Returns)
Here:
$37,982
State:
$47,881
Salary/wage: $35,362 (reported on 81.0% of returns)
Here:
$35,362
State:
$41,947
(% of AGI for various income ranges: 127.1% for AGIs below $10k, 71.3% for AGIs $10k-25k, 79.6% for AGIs $25k-50k, 79.8% for AGIs $50k-75k, 79.0% for AGIs $75k-100k, 62.1% for AGIs over 100k)
Taxable interest for individuals: $1,749 (reported on 35.2% of returns)
This zip code:
$1,749
Texas:
$2,255
(% of AGI for various income ranges: 7.8% for AGIs below $10k, 3.0% for AGIs $10k-25k, 1.2% for AGIs $25k-50k, 1.3% for AGIs $50k-75k, 0.8% for AGIs $75k-100k, 1.8% for AGIs over 100k)
Taxable dividends: $2,054 (reported on 14.0% of returns)
Here:
$2,054
State:
$4,261
(% of AGI for various income ranges: 3.0% for AGIs below $10k, 1.1% for AGIs $10k-25k, 0.7% for AGIs $25k-50k, 0.5% for AGIs $50k-75k, 0.9% for AGIs $75k-100k, 0.6% for AGIs over 100k)
Net capital gain/loss: +$5,296 (reported on 12.7% of returns)
Here:
+$5,296
State:
+$16,110
(% of AGI for various income ranges: 2.6% for AGIs below $10k, -0.1% for AGIs $10k-25k, 0.4% for AGIs $25k-50k, 0.9% for AGIs $50k-75k, 0.5% for AGIs $75k-100k, 6.2% for AGIs over 100k)
Profit/loss from business: +$7,901 (reported on 18.6% of returns)
Here:
+$7,901
State:
+$11,013
(% of AGI for various income ranges: 21.1% for AGIs below $10k, 7.7% for AGIs $10k-25k, 2.6% for AGIs $25k-50k, 1.7% for AGIs $50k-75k, 2.8% for AGIs $75k-100k, 5.1% for AGIs over 100k)
IRA payment deduction: $3,359 (reported on 1.7% of returns)
75758:
$3,359
Texas:
$3,120
Total itemized deductions: $17,430 (24% of AGI, reported on 21.3% of returns)
Here:
$17,430
State:
$19,631
Here:
23.8% of AGI
State:
18.9% of AGI
(% of AGI for various income ranges: 7.7% for AGIs below $10k, 6.4% for AGIs $10k-25k, 8.7% for AGIs $25k-50k, 10.4% for AGIs $50k-75k, 11.3% for AGIs $75k-100k, 11.2% for AGIs over 100k)
Charity contributions deductions: $4,457 (6% of AGI, reported on 17.4% of returns)
Here:
$4,457
State:
$4,753
Here:
5.8% of AGI
State:
4.2% of AGI
(% of AGI for various income ranges: 1.2% for AGIs $10k-25k, 1.4% for AGIs $25k-50k, 2.0% for AGIs $50k-75k, 2.5% for AGIs $75k-100k, 3.1% for AGIs over 100k)
Total tax: $4,957 (reported on 72.7% of returns)
75758:
$4,957
State:
$9,058
(% of AGI for various income ranges: 4.1% for AGIs below $10k, 3.8% for AGIs $10k-25k, 6.2% for AGIs $25k-50k, 8.4% for AGIs $50k-75k, 10.7% for AGIs $75k-100k, 16.9% for AGIs over 100k)
Earned income credit: $1,715 (reported on 21.0% of returns)
Here:
$1,715
State:
$2,024
Percentage of individuals using paid preparers for their 2004 taxes: 61.6%
Here:
62%
State:
57%
(% for various income ranges: 56.1% for AGIs below $10k, 66.4% for AGIs $10k-25k, 60.5% for AGIs $25k-50k, 62.1% for AGIs $50k-75k, 57.5% for AGIs $75k-100k, 66.7% for AGIs over 100k)
Household received Food Stamps/SNAP in the past 12 months: 262 Household did not receive Food Stamps/SNAP in the past 12 months: 3,548
Women who had a birth in the past 12 months: 224 (228 now married, 0 unmarried) Women who did not have a birth in the past 12 months: 1,395 (833 now married, 555 unmarried)
Housing units in zip code 75758 with a mortgage: 1,031 Houses without a mortgage: 20
Median monthly owner costs for units with a mortgage: $1,373 Median monthly owner costs for units without a mortgage: $469
Residents with income below the poverty level in 2022:
This zip code:
12.9%
Whole state:
14.0%
Residents with income below 50% of the poverty level in 2022:
This zip code:
3.3%
Whole state:
7.4%
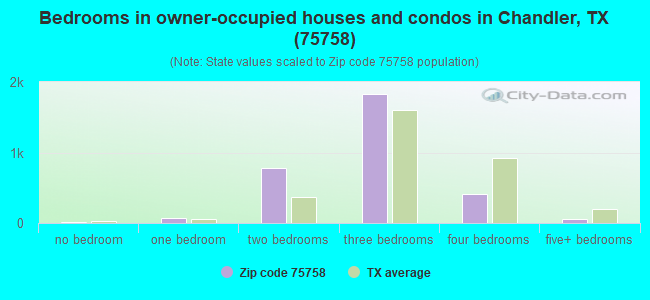
Median number of rooms in houses and condos:
Here:
5.4
State:
6.3
Median number of rooms in apartments:
Here:
4.6
State:
4.0
Notable locations in this zip code not listed on our city pages
Notable locations in zip code 75758: Westside Volunteer Fire Department (A), Chandler Volunteer Fire Department (B). Display/hide their locations on the map
Churches in zip code 75758 include: Martin Spring Church (A), Concord Church (B), Martin Springs Baptist Church (C), Forest Grove Baptist Church (D), Faith Baptist Church (E). Display/hide their locations on the map
Lakes and reservoirs: Frontier City Lake (A), Lake Palestine (B), Frontier City Lake (C), Bagley Lake (D), Kidd Lake (E). Display/hide their locations on the map
Streams, rivers, and creeks: Flat Creek (A), Martin Spring Branch (B), Gum Branch (C), Caney Creek (D), Cottonwood Creek (E). Display/hide their locations on the map
In group quarters: 80 (-1 institutionalized population)
Size of family households: 1,395 2-persons, 587 3-persons, 464 4-persons, 163 5-persons, 93 6-persons, 6 7-or-more-persons
Size of nonfamily households: 1,084 1-person, 28 2-persons
1,172 married couples with children.
117 single-parent households (105 men, 12 women).
92.6% of residents of 75758 zip code speak English at home.
6.9% of residents speak Spanish at home (52% very well, 43% well, 2% not well, 2% not at all).
0.8% of residents speak other Indo-European language at home (79% very well, 11% well, 10% not well).
Foreign born population: 445 (4.7%) (18.6% of them are naturalized citizens)
This zip code:
4.7%
Whole state:
17.2%
72%Honduras
11%Sweden
7%United Kingdom, excluding England and Scotland
2%Thailand
2%Guyana
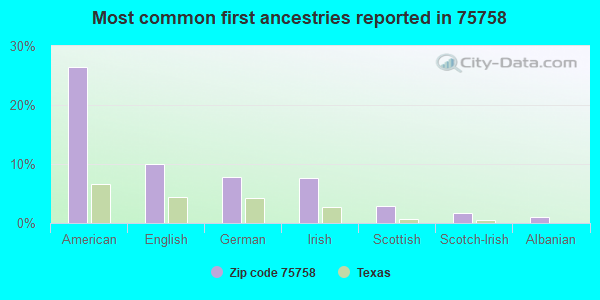
26%American
10%English
8%German
8%Irish
3%Scottish
2%Scotch-Irish
1%Albanian
Year of entry for the foreign-born population
252010 or later
3302000 to 2009
381990 to 1999
111Before 1990
Housing units lacking complete plumbing facilities: 6.1% Housing units lacking complete kitchen facilities: 3.1%
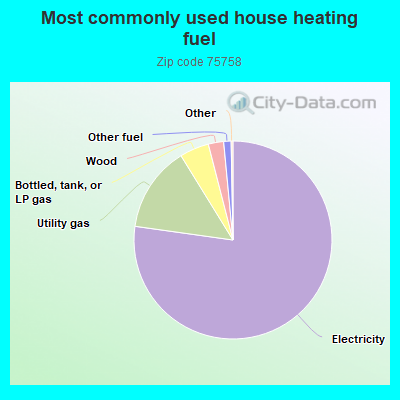
77.3%Electricity
14.0%Utility gas
4.8%Bottled, tank, or LP gas
2.5%Wood
1.2%Other fuel
Population in 1990: 4,835. Population change in the 1990s: +3,090 (+63.9%).
Place of birth for U.S.-born residents:
This state: 5,903
Northeast: 272
Midwest: 599
South: 909
West: 1,169
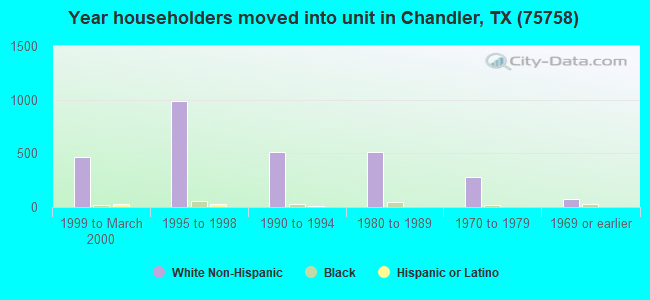
53% of the 75758 zip code residents lived in the same house 5 years ago. Out of people who lived in different houses, 30% lived in this county. Out of people who lived in different counties, 50% lived in Texas.
93% of the 75758 zip code residents lived in the same house 1 year ago. Out of people who lived in different houses, 20% moved from this county. Out of people who lived in different houses, 62% moved from different county within same state. Out of people who lived in different houses, 21% moved from different state. Out of people who lived in different houses, 3% moved from abroad.
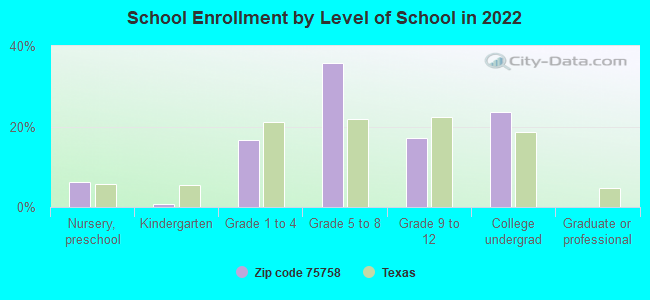
Private vs. public school enrollment:
Students in private schools in grades 1 to 8 (elementary and middle school):
Here:
0.0%
Texas:
8.8%
Students in private schools in grades 9 to 12 (high school): 14
Here:
4.8%
Texas:
8.0%
Students in private undergraduate colleges: 42
Here:
10.3%
Texas:
16.2%
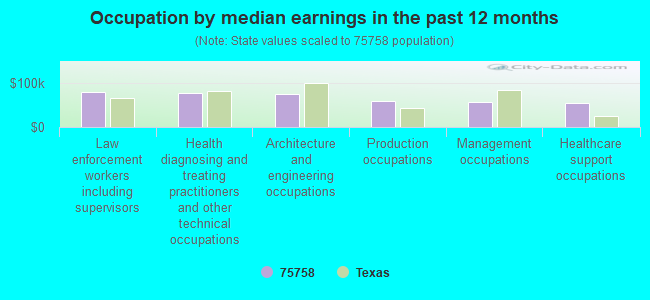
Occupation by median earnings in the past 12 months ($)
78,796Law enforcement workers including supervisors
77,701Health diagnosing and treating practitioners and other technical occupations
73,982Architecture and engineering occupations
58,142Production occupations
57,334Management occupations
53,628Healthcare support occupations
Companies with federal contracts located in this zip code:
BLACKSTONE, BILLY (2121 HICKORY HOLLOW RD in CHANDLER, TX; small business) : $4,810 in 2 contractsin 2003
$6,240 with U.S. Army Corps of Engineers - civil program financing only for Operation of Government-Owned Facilities -- Recreation Facilities (Non-Building). Taking place in AR. Signed on 2003-04-03. Completion date: 2003-09-08.
-$1,430, same as above.Signed on 2003-09-09. Completion date: 2003-09-08.
Top industries in this zip code by the number of employees in 2005:
Other Services (except Public Administration): Religious Organizations (10-19 employees: 3 establishments, 5-9 employees: 2 establishments, 1-4 employees: 7 establishments)
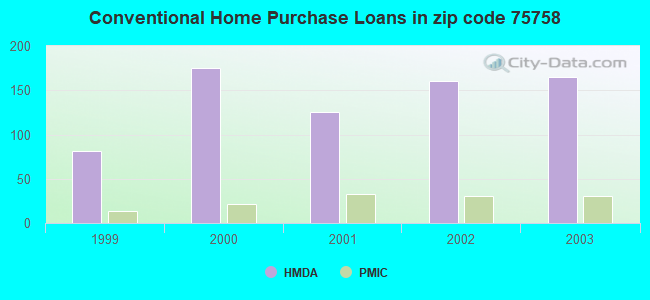
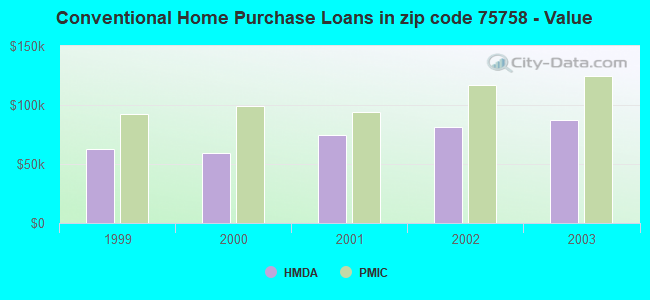
Detailed PMIC statistics for the following Tracts:9501.00
, 9514.00
2002 - 2018 National Fire Incident Reporting System (NFIRS) incidents
According to the data from the years 2002 - 2018 the average number of fires per year is 60. The highest number of reported fire incidents - 105 took place in 2010, and the least - 2 in 2003. The data has a growing trend.
When looking into fire subcategories, the most incidents belonged to: Outside Fires (52.9%), and Structure Fires (37.5%).
Fire incident types reported to NFIRS in Zip Code 75758


 Nearest zip codes: 75756, 75762, 75709, 75704, 75770, 75778.


 : $4,810 in 2 contracts in 2003

 According to the data from the years 2002 - 2018 the average number of fires per year is 60. The highest number of reported fire incidents - 105 took place in 2010, and the least - 2 in 2003. The data has a growing trend.
 When looking into fire subcategories, the most incidents belonged to: Outside Fires (52.9%), and Structure Fires (37.5%).