Beebe: Fire Incidents, Arkansas (AR)
Where are fire incidents reported in Beebe, AR
Something went wrong! Please refresh the page.
|
| |||||||||||||||||||||||||||||||||||||||||||||||||||||||||||||||||||||||||||||||||||||||||||||||||||||||||||||
| Other | 960 | |||||||||||||||||||||||||||||||||||||||||||||||||||||||||||||||||||||||||||||||||||||||||||||||||||||||||||||
2002 - 2018 National Fire Incident Reporting System (NFIRS) incidents
- Incident types reported to NFIRS in Beebe, AR
- 1,72441.2%Fire
- 1,41233.8%Rescue & EMS
- 43910.5%Good Intent Call
- 2225.3%Service Call
- 1924.6%Hazardous Condition
- 1643.9%False Alarm
- 130.3%Severe Weather
- 110.3%Special Incident
- Fire incident types reported to NFIRS in Beebe, AR
- 87550.8%Outside Fires
- 56732.9%Structure Fires
- 17710.3%Mobile Property/Vehicle Fires
- 1056.1%Other
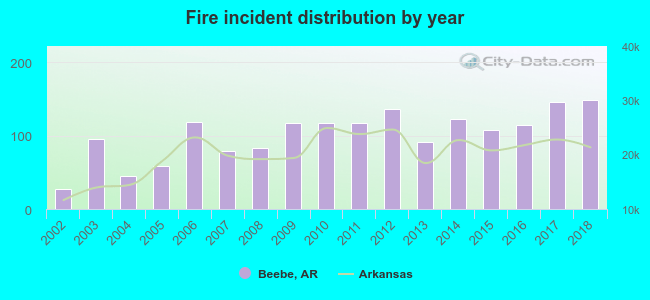 Based on the data from the years 2002 - 2018 the average number of fires per year is 101. The highest number of reported fires - 148 took place in 2018, and the least - 27 in 2002. The data has an increasing trend.
The average number of yearly fire incidents per 10k residents in Beebe, AR compared to nearest cities:
(Note: Based on data for the last 3 years, including only cities with population 5,000 and above)
| Beebe: | 171.0 |
| Cabot: | 64.8 |
| Searcy: | 91.0 |
| Jacksonville: | 71.7 |
| Sherwood: | 68.3 |
| North Little Rock: | 87.9 |
| Greenbrier: | 210.4 |
| Heber Springs: | 90.1 |
| Conway: | 51.4 |
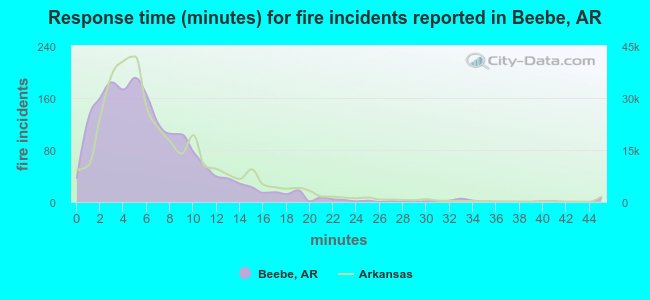 The median response time based on all reported fire incidents is 5 minutes. This is lower compared to the state median value.
The median response time in Beebe, AR compared to nearest cities:
(Note: Based on data for all years, including only cities with at least 500 fire incidents)
| Beebe: | 5 minutes |
| McRae: | 8 minutes |
| Ward: | 7 minutes |
| Austin: | 7 minutes |
| Cabot: | 6 minutes |
| Searcy: | 5 minutes |
| Vilonia: | 6 minutes |
| Jacksonville: | 5 minutes |
| Lonoke: | 9 minutes |
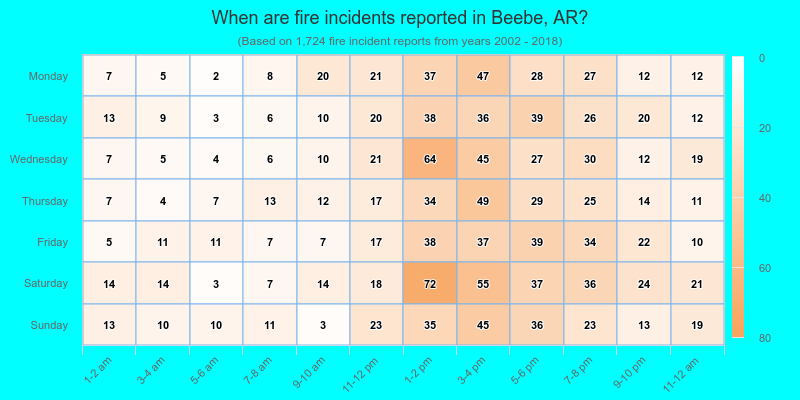
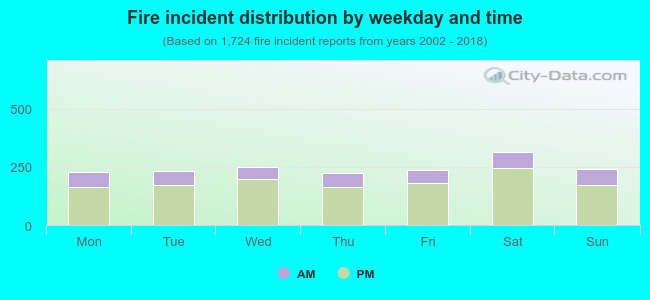 25.2% incidents where reported in the morning and 74.8% in the evening. The most fires (18.3%) took place on Saturday, and the least (12.9%) on Thursday.
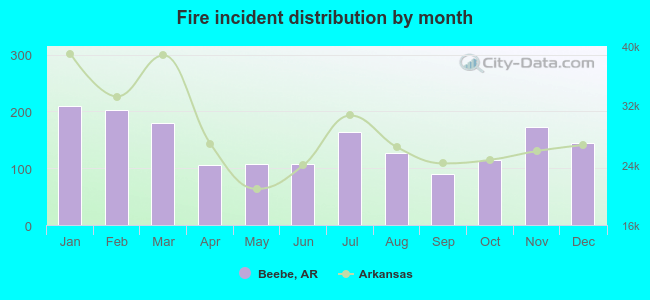 Based on the 1,724 fire incidents from years 2002 - 2018 most fires (12.2%) took place during January, and the least (5.2%) in September.
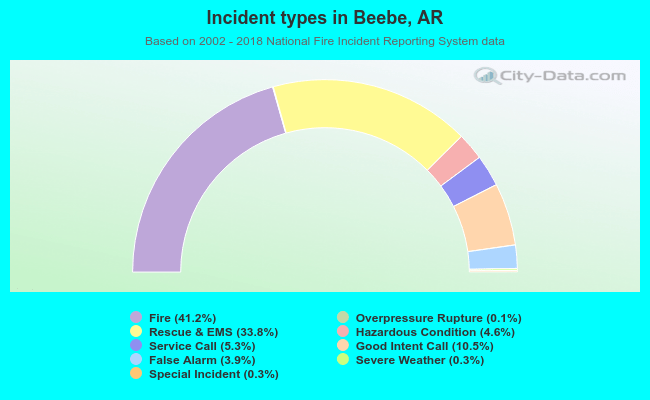 Out of all 4,181 cases reported during the years 2002 - 2018, the most belonged to the categories: Fire (41.2%), Rescue & EMS (33.8%), and Good Intent Call (10.5%).
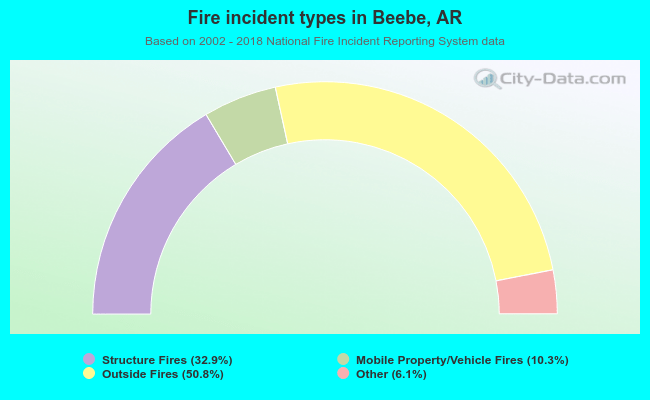 When looking into fire subcategories, the most reports belonged to: Outside Fires (50.8%), and Structure Fires (32.9%).