Montebello: Fire Incidents, California (CA)
Where are fire incidents reported in Montebello, CA
Something went wrong! Please refresh the page.
|
| |||||||||||||||||||||||||||||||||||||||||||||||||||||||||||||||||||||||||||||||||||||||||||||||||||||||||||||
2005 - 2018 National Fire Incident Reporting System (NFIRS) incidents
- Incident types reported to NFIRS in Montebello, CA
- 55947.9%Fire
- 22619.4%Good Intent Call
- 19616.8%Hazardous Condition
- 1089.3%Rescue & EMS
- 383.3%False Alarm
- 302.6%Service Call
- 70.6%Special Incident
- 30.3%Overpressure Rupture
- Fire incident types reported to NFIRS in Montebello, CA
- 21438.3%Structure Fires
- 19735.2%Outside Fires
- 11019.7%Mobile Property/Vehicle Fires
- 386.8%Other
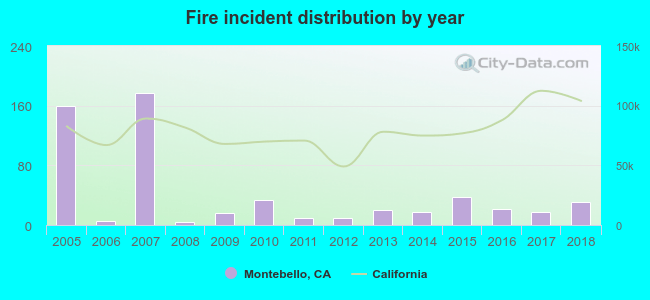 Based on the data from the years 2005 - 2018 the average number of fires per year is 40. The highest number of fire incidents - 177 took place in 2007, and the least - 4 in 2008. The data has a decreasing trend.
The average number of yearly fire incidents per 10k residents in Montebello, CA compared to nearest cities:
(Note: Based on data for the last 3 years, including only cities with population 5,000 and above)
| Montebello: | 3.6 |
| Pico Rivera: | 15.8 |
| Commerce: | 70.9 |
| South San Gabriel: | 12.4 |
| Monterey Park: | 3.6 |
| East Los Angeles: | 17.0 |
| Bell Gardens: | 18.3 |
| Rosemead: | 13.7 |
| South El Monte: | 26.1 |
 The median response time based on all reported fire incidents is 7 minutes. This is similar to the state median value.
The median response time in Montebello, CA compared to nearest cities:
(Note: Based on data for all years, including only cities with at least 500 fire incidents)
| Montebello: | 7 minutes |
| Pico Rivera: | 5 minutes |
| Commerce: | 5 minutes |
| Monterey Park: | 5 minutes |
| East Los Angeles: | 5 minutes |
| Bell Gardens: | 5 minutes |
| Rosemead: | 4 minutes |
| Bell: | 5 minutes |
| Alhambra: | 5 minutes |
 37.0% incidents where reported in the morning and 63.0% in the evening. The most fires (17.7%) took place on Sunday, and the least (12.2%) on Thursday.
 According to the 559 incident reports from years 2005 - 2018 most fires (11.3%) took place during August, and the least (4.5%) in November.
 Out of all 1,167 cases reported during the years 2005 - 2018, the most belonged to the categories: Fire (47.9%), Good Intent Call (19.4%), and Hazardous Condition (16.8%).
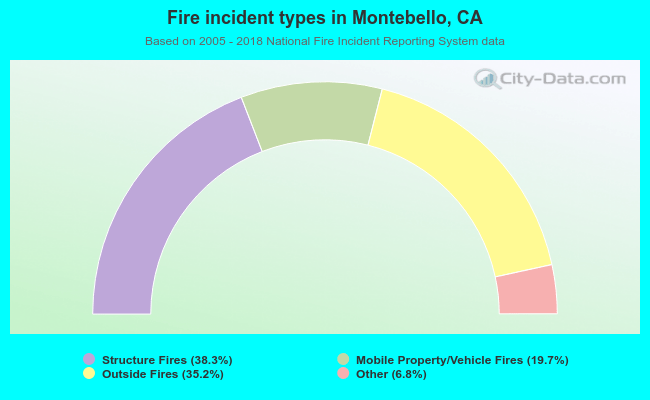 When looking into fire subcategories, the most reports belonged to: Structure Fires (38.3%), and Outside Fires (35.2%).