Bolingbrook: Fire Incidents, Illinois (IL)
Where are fire incidents reported in Bolingbrook, IL
Something went wrong! Please refresh the page.
| Fire incidents reported | |
|---|---|
| Sreet name | Count |
| BOLINGBROOK DR | 330 |
| BOUGHTON RD | 294 |
| PRESTON DR | 156 |
| WEBER RD | 156 |
| WOODCREEK DR | 148 |
| BRIARCLIFF RD | 110 |
| 53 DR | 86 |
| BOUGHTON | 86 |
| INTERSTATE 55 | 86 |
| REMINGTON BLVD | 76 |
| SCHMIDT RD | 64 |
| LILY CACHE LN | 60 |
| FERNWOOD DR | 56 |
| CROSSROADS PKY | 54 |
| OLD CHICAGO DR | 54 |
| KILDEER DR | 44 |
| PINECREST RD | 42 |
| WHITEWATER DR | 42 |
| PRESTON | 38 |
| BOLINGBROOK | 36 |
| WEBER | 34 |
| ASHBURY AVE | 32 |
| ROCKHURST RD | 32 |
| NORTHRIDGE AVE | 30 |
| RECREATION DR | 30 |
| JANES AVE | 28 |
| NB55 HWY | 28 |
| S/B 55 HWY | 28 |
| BEACONRIDGE DR | 26 |
| SOUTH FRONTAGE RD | 26 |
| Other | 711 |
2002 - 2018 National Fire Incident Reporting System (NFIRS) incidents
- Incident types reported to NFIRS in Bolingbrook, IL
- 24,72553.4%Rescue & EMS
- 5,55212.0%Service Call
- 4,5339.8%False Alarm
- 3,7118.0%Hazardous Condition
- 3,0236.5%Fire
- 2,4205.2%Special Incident
- 2,1874.7%Good Intent Call
- 910.2%Overpressure Rupture
- Fire incident types reported to NFIRS in Bolingbrook, IL
- 1,14037.7%Outside Fires
- 1,11336.8%Structure Fires
- 61520.3%Mobile Property/Vehicle Fires
- 1555.1%Other
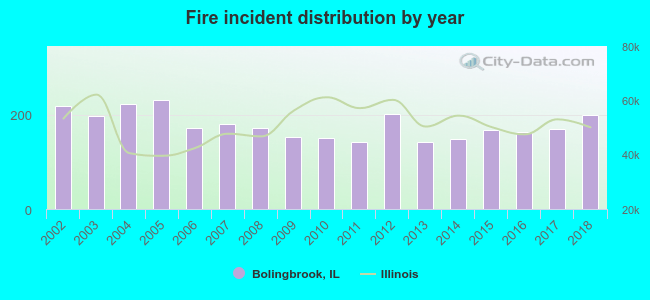 Based on the data from the years 2002 - 2018 the average number of fires per year is 178. The highest number of fires - 230 took place in 2005, and the least - 141 in 2011. The data has a declining trend.
The average number of yearly fire incidents per 10k residents in Bolingbrook, IL compared to nearest cities:
(Note: Based on data for the last 3 years, including only cities with population 5,000 and above)
| Bolingbrook: | 23.8 |
| Woodridge: | 20.6 |
| Romeoville: | 31.3 |
| Naperville: | 16.1 |
| Lemont: | 40.6 |
| Darien: | 21.1 |
| Lisle: | 29.1 |
| Downers Grove: | 20.0 |
| Lockport: | 43.1 |
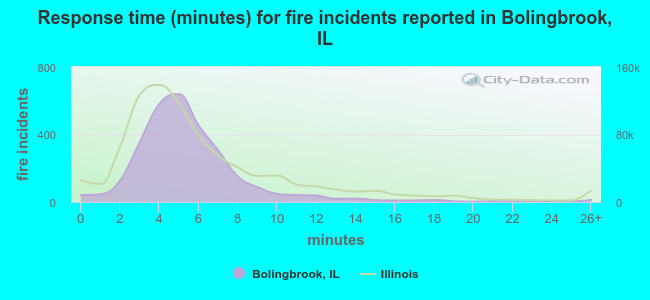 The median response time based on all reported fire incidents is 5 minutes. This is comparable to the state median value.
The median response time in Bolingbrook, IL compared to nearest cities:
(Note: Based on data for all years, including only cities with at least 500 fire incidents)
| Bolingbrook: | 5 minutes |
| Woodridge: | 5 minutes |
| Romeoville: | 5 minutes |
| Naperville: | 5 minutes |
| Lemont: | 7 minutes |
| Darien: | 5 minutes |
| Lisle: | 5 minutes |
| Downers Grove: | 5 minutes |
| Lockport: | 5 minutes |
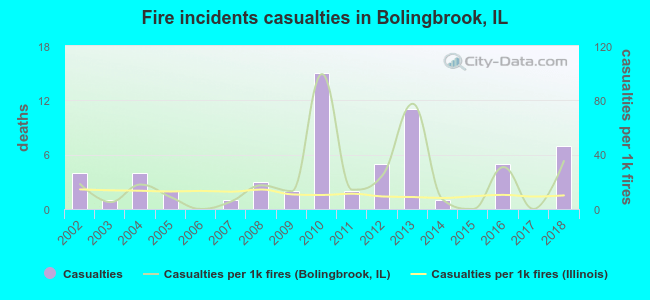 According to the reports from the years 2002 - 2018 the average number of fire-related casualties per year is 4. The highest number of reported injuries - 15 took place in 2010, and the lowest - 0 in 2006. The data has a rising trend.
The average number of injuries per 1,000 fire incidents is 22. This indicator was the highest - 99 in 2010, and the lowest 0 in 2006. The trend for casualties per 1,000 fire incidents is increasing. Compared to the Illinois value the number of injuries per 1,000 incidents is higher.
According to the reports from the years 2002 - 2018 the average number of fire-related casualties per year is 4. The highest number of reported injuries - 15 took place in 2010, and the lowest - 0 in 2006. The data has a rising trend.
The average number of injuries per 1,000 fire incidents is 22. This indicator was the highest - 99 in 2010, and the lowest 0 in 2006. The trend for casualties per 1,000 fire incidents is increasing. Compared to the Illinois value the number of injuries per 1,000 incidents is higher.Casualties per 1,000 incidents in Bolingbrook, IL compared to nearest cities:
(Note: Based on data for all years, including only cities with at least 500 fire incidents)
| Bolingbrook: | 20.8 |
| Woodridge: | 19.9 |
| Romeoville: | 12.2 |
| Naperville: | 23.5 |
| Lemont: | 8.4 |
| Darien: | 12.9 |
| Lisle: | 26.1 |
| Downers Grove: | 21.9 |
| Lockport: | 16.0 |
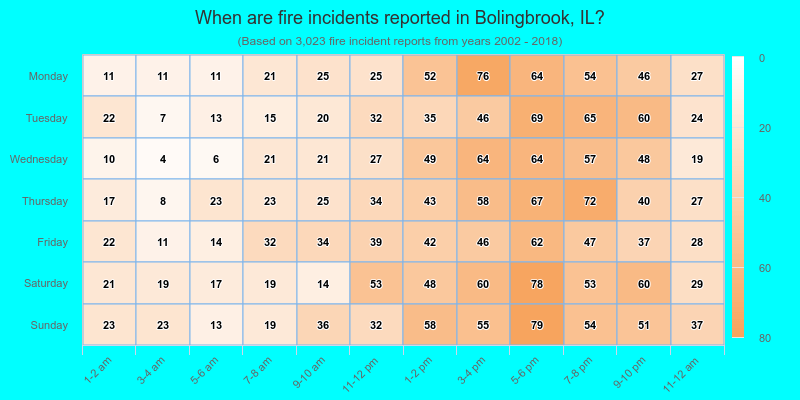
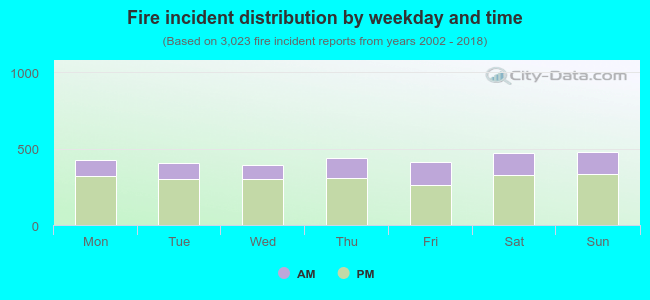 28.9% incidents where reported in the morning and 71.1% in the evening. The most fires (15.9%) took place on Sunday, and the least (12.9%) on Wednesday.
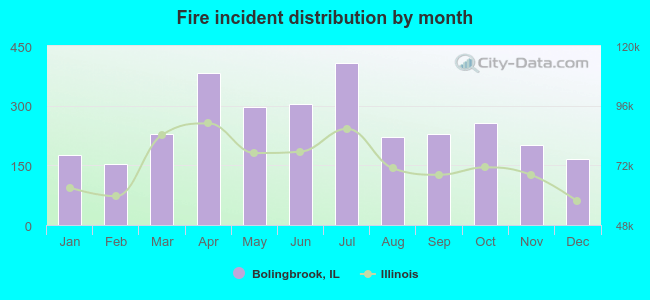 According to the 3,023 reports from years 2002 - 2018 most fires (13.5%) took place during July, and the least (5.1%) in February.
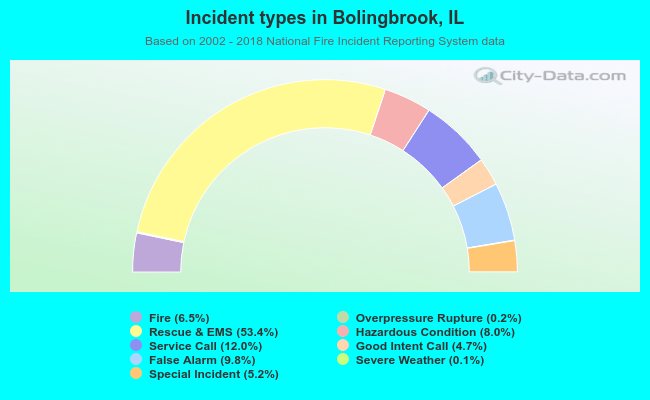 Out of all 46,266 cases reported during the years 2002 - 2018, the most belonged to the categories: Rescue & EMS (53.4%), Service Call (12.0%), and False Alarm (9.8%).
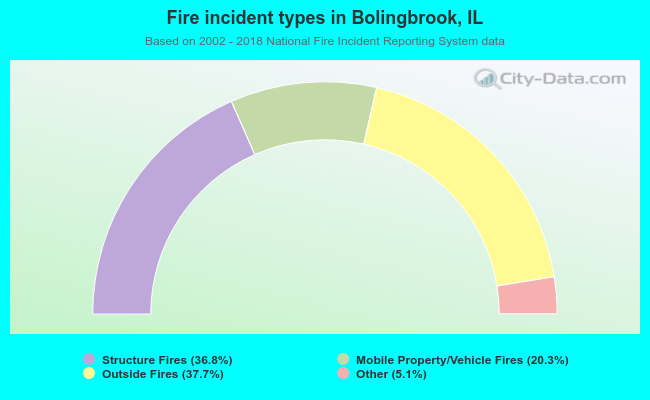 When looking into fire subcategories, the most reports belonged to: Outside Fires (37.7%), and Structure Fires (36.8%).