Bossier City: Fire Incidents, Louisiana (LA)
Where are fire incidents reported in Bossier City, LA
Something went wrong! Please refresh the page.
| Fire incidents reported | |
|---|---|
| Sreet name | Count |
| TEXAS ST | 416 |
| AIRLINE DR | 332 |
| BENTON RD | 218 |
| SHED RD | 202 |
| BARKSDALE BLV | 154 |
| I20W | 104 |
| I20E | 96 |
| OLD MINDEN RD | 76 |
| I220W | 70 |
| BARKSDALE BLV | 66 |
| I220E | 62 |
| I220 | 58 |
| I20 | 52 |
| VIKING DR | 52 |
| SWANLAKE RD | 46 |
| ARTHUR RAY TEAGUE | 40 |
| RIVERSIDE DR | 38 |
| SLIGO RD | 38 |
| MONTGOMERY LN | 36 |
| RIVERWOOD CIR | 36 |
| INDUSTRIAL DR | 34 |
| HAMILTON RD | 32 |
| SCOTT ST | 32 |
| TRAFFIC ST | 32 |
| WALLER AVE | 30 |
| YARBROUGH ST | 30 |
| DIAMOND JACKS BLV | 28 |
| VILLAGE LN | 28 |
| WESTGATE LN | 28 |
| LORECO ST | 26 |
| Other | 535 |
2002 - 2018 National Fire Incident Reporting System (NFIRS) incidents
- Incident types reported to NFIRS in Bossier City, LA
- 26,77570.9%Rescue & EMS
- 3,0278.0%Fire
- 2,5876.9%Good Intent Call
- 2,3806.3%Service Call
- 1,9705.2%Hazardous Condition
- 9302.5%False Alarm
- 460.1%Overpressure Rupture
- Fire incident types reported to NFIRS in Bossier City, LA
- 1,21640.2%Outside Fires
- 92430.5%Structure Fires
- 64621.3%Mobile Property/Vehicle Fires
- 2418.0%Other
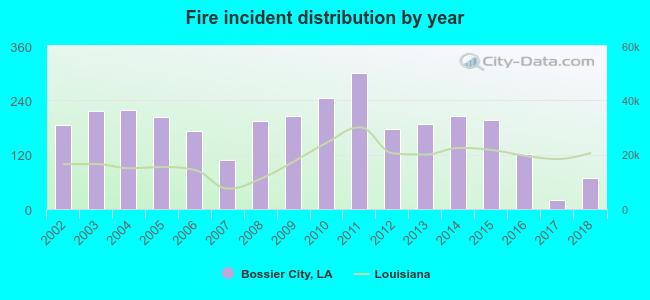 According to the data from the years 2002 - 2018 the average number of fires per year is 178. The highest number of reported fires - 301 took place in 2011, and the least - 19 in 2017. The data has a dropping trend.
The average number of yearly fire incidents per 10k residents in Bossier City, LA compared to nearest cities:
(Note: Based on data for the last 3 years, including only cities with population 5,000 and above)
| Bossier City: | 10.3 |
| Shreveport: | 63.1 |
| Minden: | 91.1 |
| Mansfield: | 78.6 |
| Springhill: | 69.0 |
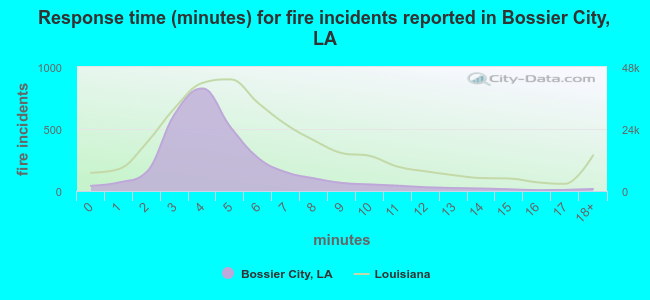 The median response time based on all reported fire incidents is 4 minutes. This is lower than the Louisiana median value.
The median response time in Bossier City, LA compared to nearest cities:
(Note: Based on data for all years, including only cities with at least 500 fire incidents)
| Bossier City: | 4 minutes |
| Shreveport: | 5 minutes |
| Haughton: | 6 minutes |
| Benton: | 7 minutes |
| Minden: | 5 minutes |
| Plain Dealing: | 9 minutes |
| Ringgold: | 8 minutes |
| Vivian: | 6 minutes |
| Mansfield: | 6 minutes |
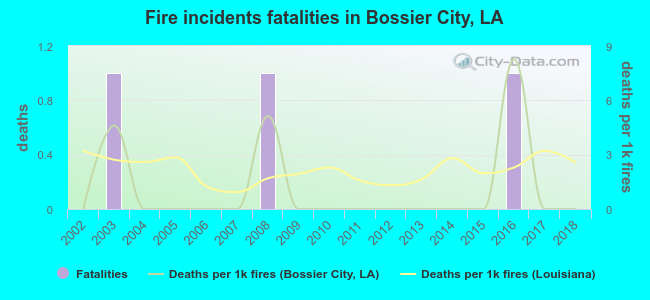 According to the reports from the years 2002 - 2018 the average number of fire-related fatalities per year is 0. The highest number of deaths - 1 took place in 2003, and the lowest - 0 in 2002. The data has a constant trend.
The average number of deaths per 1,000 fire incidents is 1. This indicator was the highest - 8 in 2016, and the lowest 0 in 2002. The trend for fatalities per 1,000 fires is constant. Compared to the Louisiana value the number of fatalities per 1,000 incidents is much lower.
According to the reports from the years 2002 - 2018 the average number of fire-related fatalities per year is 0. The highest number of deaths - 1 took place in 2003, and the lowest - 0 in 2002. The data has a constant trend.
The average number of deaths per 1,000 fire incidents is 1. This indicator was the highest - 8 in 2016, and the lowest 0 in 2002. The trend for fatalities per 1,000 fires is constant. Compared to the Louisiana value the number of fatalities per 1,000 incidents is much lower.Deaths per 1,000 incidents in Bossier City, LA compared to nearest cities:
(Note: Based on data for all years, including only cities with at least 2,500 fire incidents)
| Bossier City: | 1.0 |
| Shreveport: | 1.6 |
 Based on the reports from the years 2002 - 2018 the average number of fire-related yearly casualties is 2. The highest number of injuries - 7 took place in 2003, and the lowest - 0 in 2005. The data has a declining trend.
The average number of injuries per 1,000 fires is 11. This indicator was the highest - 32 in 2003, and the lowest 0 in 2005. The trend for casualties per 1,000 incidents is rising. Compared to the state value the number of casualties per 1,000 incidents is much higher.
Based on the reports from the years 2002 - 2018 the average number of fire-related yearly casualties is 2. The highest number of injuries - 7 took place in 2003, and the lowest - 0 in 2005. The data has a declining trend.
The average number of injuries per 1,000 fires is 11. This indicator was the highest - 32 in 2003, and the lowest 0 in 2005. The trend for casualties per 1,000 incidents is rising. Compared to the state value the number of casualties per 1,000 incidents is much higher.Casualties per 1,000 incidents in Bossier City, LA compared to nearest cities:
(Note: Based on data for all years, including only cities with at least 500 fire incidents)
| Bossier City: | 11.9 |
| Shreveport: | 4.2 |
| Haughton: | 4.2 |
| Benton: | 4.4 |
| Minden: | 11.1 |
| Plain Dealing: | 2.3 |
| Ringgold: | 2.8 |
| Vivian: | 0.0 |
| Mansfield: | 4.5 |
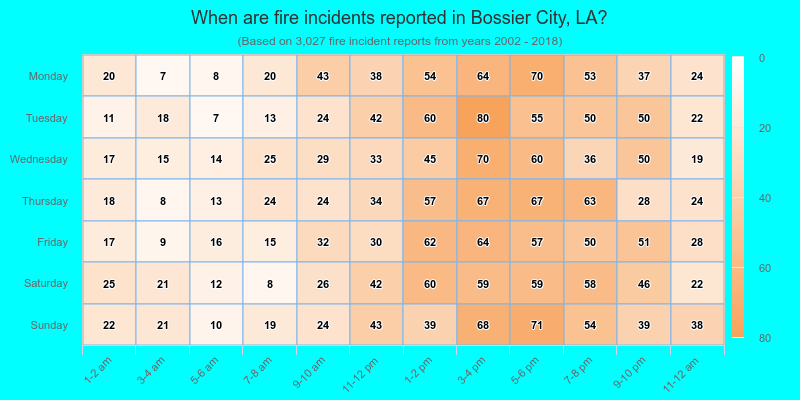
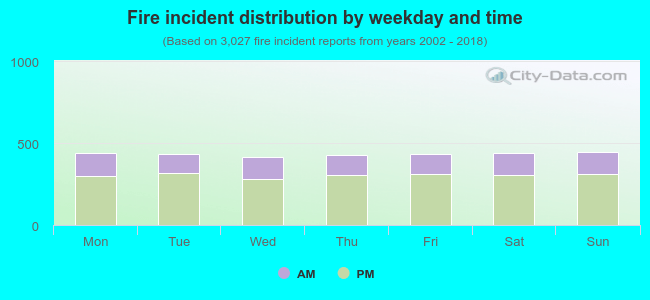 29.6% incidents where reported in the morning and 70.4% in the evening. The most fires (14.8%) took place on Sunday, and the least (13.6%) on Wednesday.
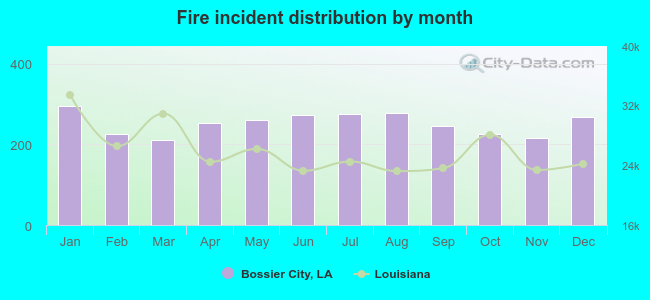 According to the 3,027 incident reports from years 2002 - 2018 most fires (9.8%) took place during January, and the least (6.9%) in March.
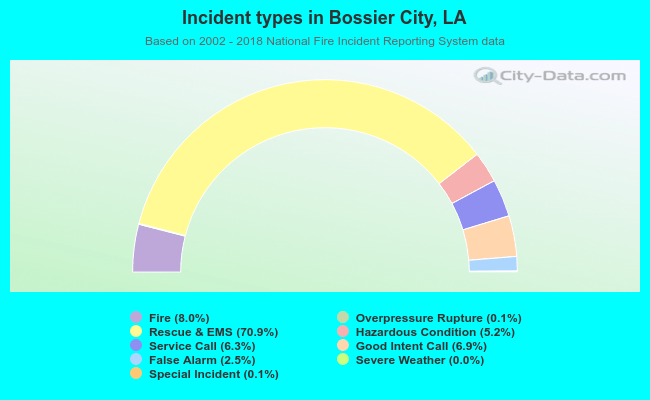 Out of all 37,759 cases reported during the years 2002 - 2018, the most belonged to the categories: Rescue & EMS (70.9%), Fire (8.0%), and Good Intent Call (6.9%).
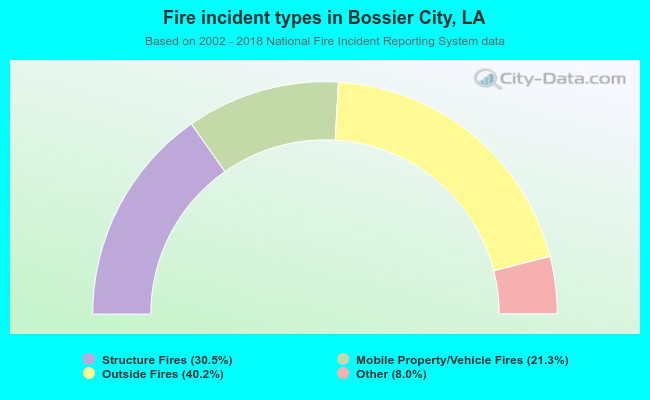 When looking into fire subcategories, the most incidents belonged to: Outside Fires (40.2%), and Structure Fires (30.5%).