Ringgold: Fire Incidents, Louisiana (LA)
Where are fire incidents reported in Ringgold, LA
Something went wrong! Please refresh the page.
|
| |||||||||||||||||||||||||||||||||||||||||||||||||||||||||||||||||||||||||||||||||||||||||||||||||||||||||||||
2004 - 2018 National Fire Incident Reporting System (NFIRS) incidents
- Incident types reported to NFIRS in Ringgold, LA
- 1,77057.3%Rescue & EMS
- 71123.0%Fire
- 32210.4%Service Call
- 1384.5%Hazardous Condition
- 722.3%Good Intent Call
- 591.9%False Alarm
- 130.4%Severe Weather
- Fire incident types reported to NFIRS in Ringgold, LA
- 44462.4%Outside Fires
- 18526.0%Structure Fires
- 669.3%Mobile Property/Vehicle Fires
- 162.3%Other
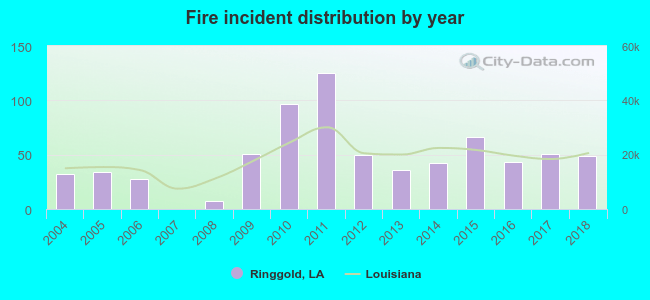 Based on the data from the years 2004 - 2018 the average number of fires per year is 47. The highest number of fires - 125 took place in 2011, and the least - 0 in 2007. The data has a growing trend.
 The median response time based on all reported fire incidents is 8 minutes. This is higher compared to the Louisiana median value.
The median response time in Ringgold, LA compared to nearest cities:
(Note: Based on data for all years, including only cities with at least 500 fire incidents)
| Ringgold: | 8 minutes |
| Haughton: | 6 minutes |
| Minden: | 5 minutes |
| Coushatta: | 9 minutes |
| Bossier City: | 4 minutes |
| Shreveport: | 5 minutes |
| Campti: | 8 minutes |
| Mansfield: | 6 minutes |
| Simsboro: | 9 minutes |
 Based on the reports from the years 2004 - 2018 the average number of fire-related fatalities per year is 0. The highest number of deaths - 1 took place in 2004, and the lowest - 0 in 2005. The data has a decreasing trend.
 24.1% incidents where reported in the morning and 75.9% in the evening. The most fires (18.4%) took place on Monday, and the least (12.4%) on Friday.
 Based on the 711 reports from years 2004 - 2018 most fires (11.3%) took place during September, and the least (4.4%) in December.
 Out of all 3,087 cases reported during the years 2004 - 2018, the most belonged to the categories: Rescue & EMS (57.3%), Fire (23.0%), and Service Call (10.4%).
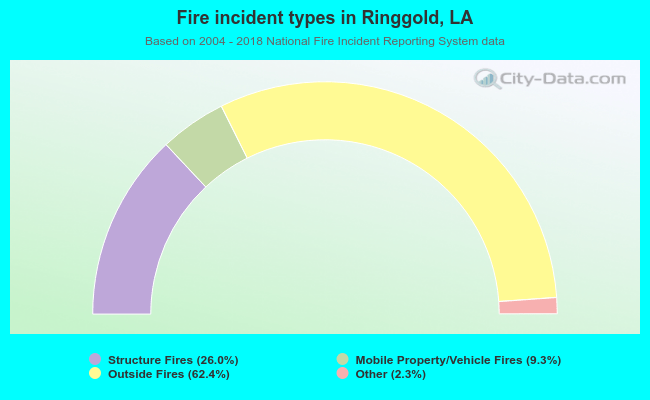 When looking into fire subcategories, the most incidents belonged to: Outside Fires (62.4%), and Structure Fires (26.0%).