Shreveport: Fire Incidents, Louisiana (LA)
Where are fire incidents reported in Shreveport, LA
Something went wrong! Please refresh the page.
| Fire incidents reported | |
|---|---|
| Sreet name | Count |
| YOUREE DR | 340 |
| MARKET ST | 334 |
| 70TH ST | 324 |
| BERT KOUNS INDUSTRIAL LOOP | 312 |
| LAKESHORE DR | 304 |
| MANSFIELD RD | 276 |
| GREENWOOD RD | 232 |
| INTERSTATE 20 W | 180 |
| INTERSTATE 20 E | 172 |
| PINES RD | 172 |
| KINGS HWY | 152 |
| BUNCOMBE RD | 128 |
| RUSSELL RD | 124 |
| JEWELLA AV | 116 |
| HOLLYWOOD AV | 114 |
| FLOURNOY LUCAS RD | 112 |
| JORDAN ST | 110 |
| OLD MOORINGSPORT RD | 110 |
| MILAM ST | 106 |
| LINE AV | 102 |
| TERRY BRADSHAW PASSWAY E | 102 |
| HEARNE AV | 100 |
| INTERSTATE 49 N | 100 |
| COLLEGE ST | 98 |
| COTTON ST | 96 |
| JEWELLA AV | 96 |
| LINWOOD AV | 96 |
| JEFFERSON PAIGE RD | 92 |
| INTERSTATE 49 S | 90 |
| KINGSTON RD | 90 |
| Other | 7,703 |
2002 - 2018 National Fire Incident Reporting System (NFIRS) incidents
- Incident types reported to NFIRS in Shreveport, LA
- 117,64863.3%Rescue & EMS
- 24,40613.1%Good Intent Call
- 14,3747.7%Service Call
- 12,4836.7%Fire
- 8,7364.7%Hazardous Condition
- 7,1613.9%False Alarm
- 7250.4%Special Incident
- 2160.1%Severe Weather
- Fire incident types reported to NFIRS in Shreveport, LA
- 5,36343.0%Structure Fires
- 4,16933.4%Outside Fires
- 2,12717.0%Mobile Property/Vehicle Fires
- 8246.6%Other
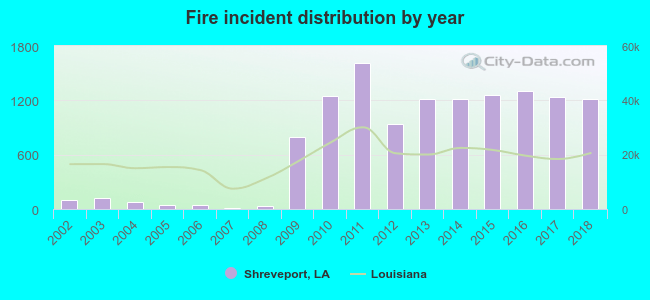 According to the data from the years 2002 - 2018 the average number of fires per year is 734. The highest number of fire incidents - 1,617 took place in 2011, and the least - 15 in 2007. The data has a growing trend.
The average number of yearly fire incidents per 10k residents in Shreveport, LA compared to nearest cities:
(Note: Based on data for the last 3 years, including only cities with population 5,000 and above)
| Shreveport: | 63.1 |
| Bossier City: | 10.3 |
| Minden: | 91.1 |
| Mansfield: | 78.6 |
| Springhill: | 69.0 |
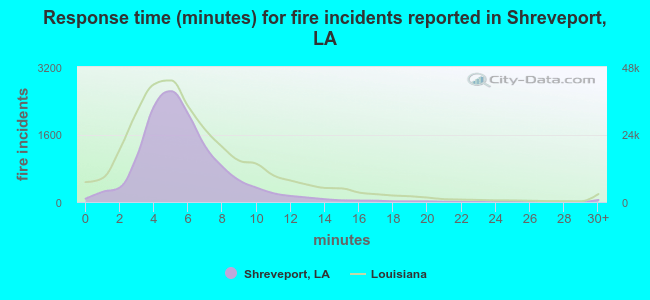 The median response time based on all reported fire incidents is 5 minutes. This is lower than the state median value.
The median response time in Shreveport, LA compared to nearest cities:
(Note: Based on data for all years, including only cities with at least 500 fire incidents)
| Shreveport: | 5 minutes |
| Bossier City: | 4 minutes |
| Benton: | 7 minutes |
| Haughton: | 6 minutes |
| Ringgold: | 8 minutes |
| Minden: | 5 minutes |
| Mansfield: | 6 minutes |
| Vivian: | 6 minutes |
| Plain Dealing: | 9 minutes |
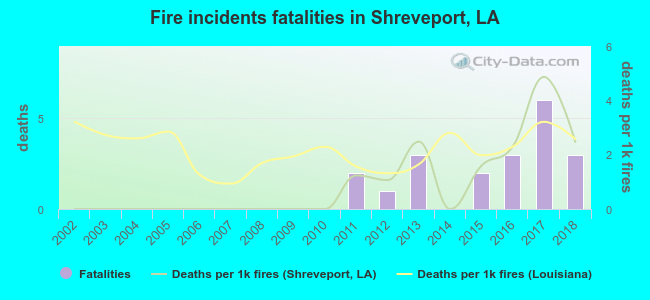 Based on the reports from the years 2002 - 2018 the average number of fire-related fatalities per year is 1. The highest number of deaths - 6 took place in 2017, and the lowest - 0 in 2002. The data has a rising trend.
The average number of deaths per 1,000 fire incidents is 1. This indicator was the highest - 5 in 2017, and the lowest 0 in 2002. The trend for fatalities per 1,000 fires is growing. Compared to the Louisiana value the number of fatalities per 1,000 fire incidents is lower.
Based on the reports from the years 2002 - 2018 the average number of fire-related fatalities per year is 1. The highest number of deaths - 6 took place in 2017, and the lowest - 0 in 2002. The data has a rising trend.
The average number of deaths per 1,000 fire incidents is 1. This indicator was the highest - 5 in 2017, and the lowest 0 in 2002. The trend for fatalities per 1,000 fires is growing. Compared to the Louisiana value the number of fatalities per 1,000 fire incidents is lower.Deaths per 1,000 incidents in Shreveport, LA compared to nearest cities:
(Note: Based on data for all years, including only cities with at least 2,500 fire incidents)
| Shreveport: | 1.6 |
| Bossier City: | 1.0 |
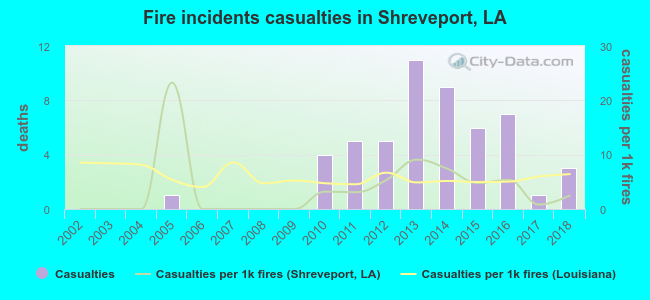 Based on the data from the years 2002 - 2018 the average number of fire-related casualties per year is 3. The highest number of reported casualties - 11 took place in 2013, and the lowest - 0 in 2002. The data has a growing trend.
The average number of injuries per 1,000 fire incidents is 4. This indicator was the highest - 23 in 2005, and the lowest 0 in 2002. The trend for injuries per 1,000 incidents is rising. Compared to the Louisiana value the number of injuries per 1,000 fires is lower.
Based on the data from the years 2002 - 2018 the average number of fire-related casualties per year is 3. The highest number of reported casualties - 11 took place in 2013, and the lowest - 0 in 2002. The data has a growing trend.
The average number of injuries per 1,000 fire incidents is 4. This indicator was the highest - 23 in 2005, and the lowest 0 in 2002. The trend for injuries per 1,000 incidents is rising. Compared to the Louisiana value the number of injuries per 1,000 fires is lower.Casualties per 1,000 incidents in Shreveport, LA compared to nearest cities:
(Note: Based on data for all years, including only cities with at least 500 fire incidents)
| Shreveport: | 4.2 |
| Bossier City: | 11.9 |
| Benton: | 4.4 |
| Haughton: | 4.2 |
| Ringgold: | 2.8 |
| Minden: | 11.1 |
| Mansfield: | 4.5 |
| Vivian: | 0.0 |
| Plain Dealing: | 2.3 |
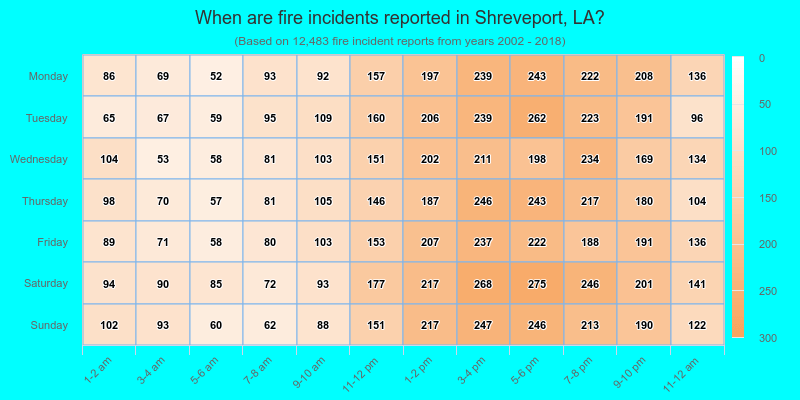
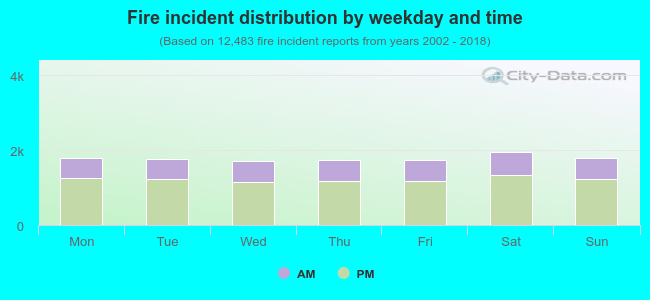 31.5% incidents where reported in the morning and 68.5% in the evening. The most fires (15.7%) took place on Saturday, and the least (13.6%) on Wednesday.
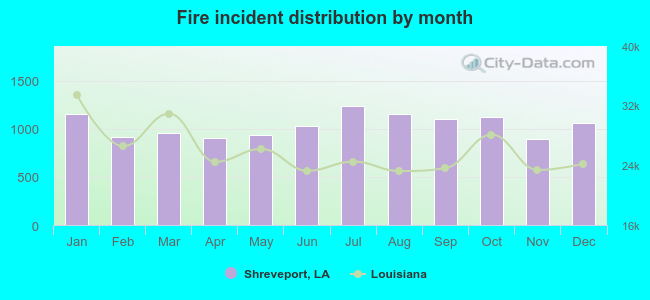 Based on the 12,483 reports from years 2002 - 2018 most fires (9.9%) took place during July, and the least (7.2%) in November.
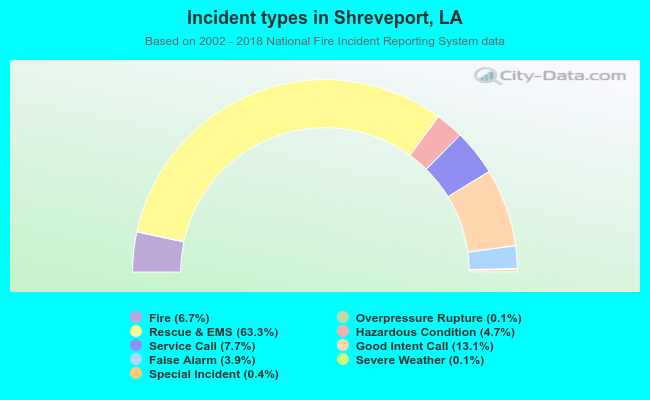 Out of all 185,864 cases reported during the years 2002 - 2018, the most belonged to the categories: Rescue & EMS (63.3%), Good Intent Call (13.1%), and Service Call (7.7%).
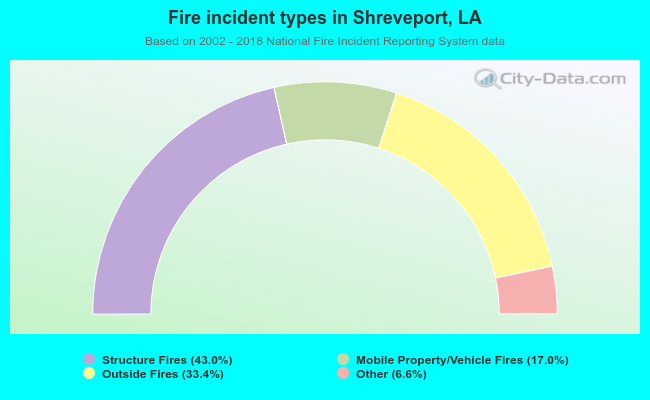 When looking into fire subcategories, the most reports belonged to: Structure Fires (43.0%), and Outside Fires (33.4%).