Brookhaven: Fire Incidents, Pennsylvania (PA)
Where are fire incidents reported in Brookhaven, PA
Something went wrong! Please refresh the page.
|
| |||||||||||||||||||||||||||||||||||||||||||||||||||||||||||||||||||||||||||||||||||||||||||||||||||||||||||||
2004 - 2018 National Fire Incident Reporting System (NFIRS) incidents
- Incident types reported to NFIRS in Brookhaven, PA
- 84238.4%Hazardous Condition
- 50222.9%Fire
- 22510.3%Special Incident
- 21910.0%False Alarm
- 1938.8%Rescue & EMS
- 1567.1%Good Intent Call
- 562.6%Service Call
- Fire incident types reported to NFIRS in Brookhaven, PA
- 33767.1%Structure Fires
- 11723.3%Outside Fires
- 377.4%Mobile Property/Vehicle Fires
- 112.2%Other
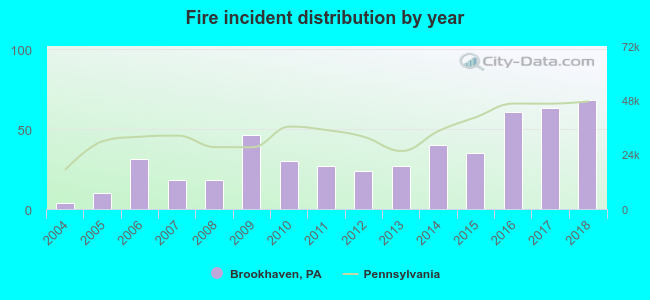 Based on the data from the years 2004 - 2018 the average number of fires per year is 33. The highest number of fire incidents - 68 took place in 2018, and the least - 4 in 2004. The data has a growing trend.
The average number of yearly fire incidents per 10k residents in Brookhaven, PA compared to nearest cities:
(Note: Based on data for the last 3 years, including only cities with population 5,000 and above)
| Brookhaven: | 79.3 |
| Chester: | 79.4 |
| Woodlyn: | 9.5 |
| Swarthmore: | 52.1 |
| Media: | 151.6 |
| Ridley Park: | 72.5 |
| Folsom: | 28.4 |
| Prospect Park: | 31.9 |
| Springfield: | 14.6 |
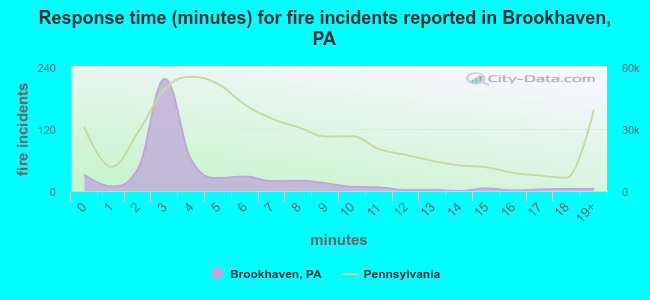 The median response time based on all reported fire incidents is 3 minutes. This is much lower compared to the Pennsylvania median value.
The median response time in Brookhaven, PA compared to nearest cities:
(Note: Based on data for all years, including only cities with at least 500 fire incidents)
| Brookhaven: | 3 minutes |
| Chester: | 4 minutes |
| Media: | 6 minutes |
| Claymont: | 6 minutes |
| Collingdale: | 4 minutes |
| Broomall: | 6 minutes |
| Darby: | 5 minutes |
| Paulsboro: | 8 minutes |
| Yeadon: | 5 minutes |
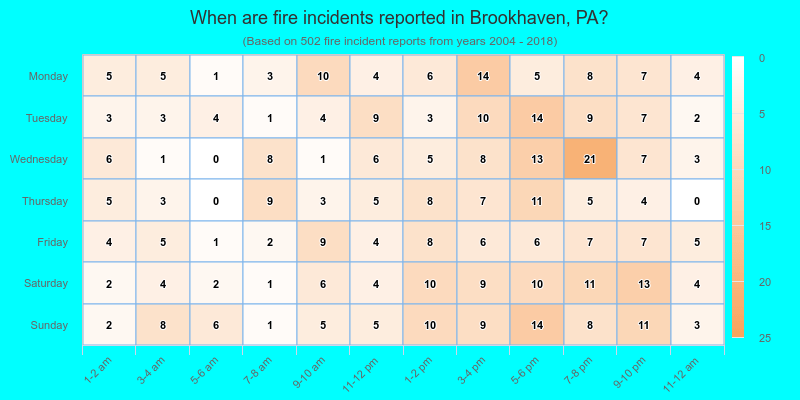
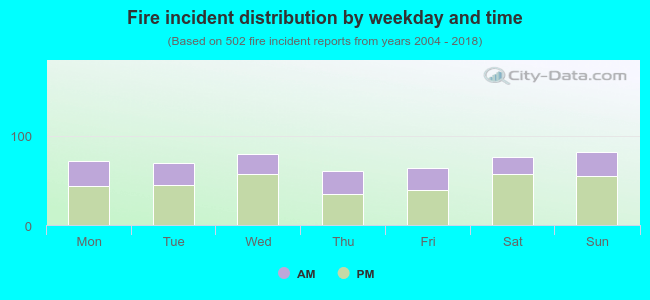 33.9% incidents where reported in the morning and 66.1% in the evening. The most fires (16.3%) took place on Sunday, and the least (12.0%) on Thursday.
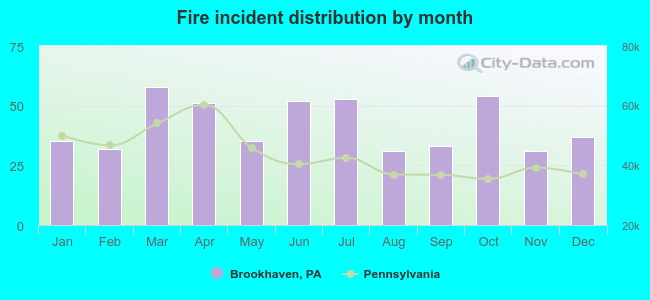 According to the 502 fires from years 2004 - 2018 most fires (11.6%) took place during March, and the least (6.2%) in August.
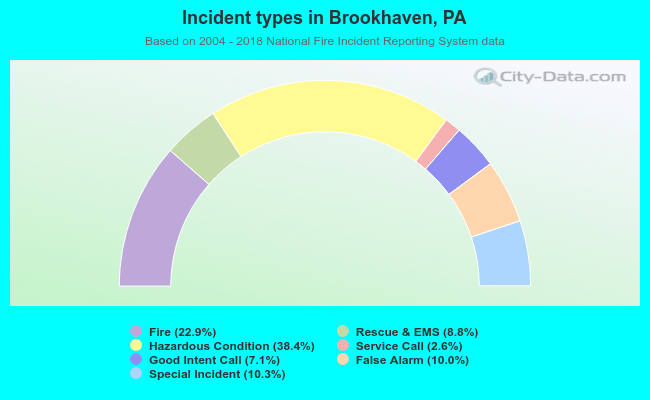 Out of all 2,193 cases reported during the years 2004 - 2018, the most belonged to the categories: Rescue & EMS (38.4%), Fire (22.9%), and False Alarm (10.3%).
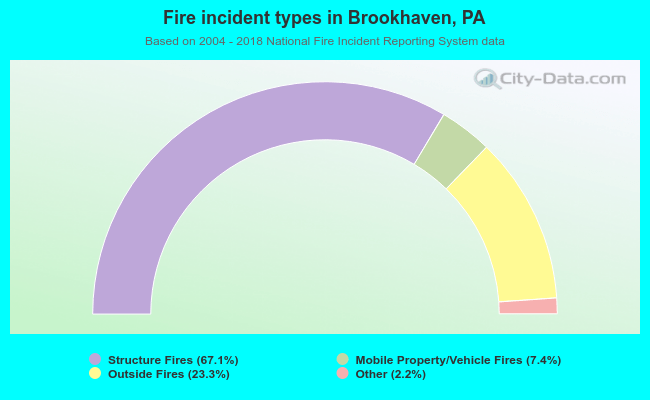 When looking into fire subcategories, the most incidents belonged to: Structure Fires (67.1%), and Outside Fires (23.3%).