Pueblo: Fire Incidents, Colorado (CO)
Where are fire incidents reported in Pueblo, CO
Something went wrong! Please refresh the page.
| Fire incidents reported | |
|---|---|
| Sreet name | Count |
| SANTA FE AVE | 512 |
| 8TH ST | 410 |
| 4TH ST | 320 |
| 13TH ST | 302 |
| 12TH ST | 278 |
| PUEBLO BLVD | 274 |
| 11TH ST | 270 |
| ELIZABETH ST | 218 |
| LAKE AVE | 206 |
| GRAND AVE | 200 |
| EVANS AVE | 198 |
| ORMAN AVE | 186 |
| 10TH ST | 182 |
| PRAIRIE AVE | 182 |
| NORTHERN AVE | 180 |
| ABRIENDO AVE | 174 |
| 14TH ST | 168 |
| 6TH ST | 168 |
| LAMAR AVE | 166 |
| 7TH ST | 160 |
| ROUTT AVE | 158 |
| SPRUCE ST | 148 |
| 5TH ST | 136 |
| PINE ST | 136 |
| 3RD ST | 134 |
| UNION AVE | 132 |
| CENTRAL MAIN ST | 126 |
| 2ND ST | 120 |
| 15TH ST | 118 |
| 18TH ST | 118 |
| Other | 2,991 |
2003 - 2018 National Fire Incident Reporting System (NFIRS) incidents
- Incident types reported to NFIRS in Pueblo, CO
- 65,11258.2%Rescue & EMS
- 15,60313.9%Good Intent Call
- 9,0718.1%Fire
- 8,7327.8%Hazardous Condition
- 7,4846.7%False Alarm
- 5,8375.2%Service Call
- Fire incident types reported to NFIRS in Pueblo, CO
- 4,03944.5%Outside Fires
- 3,28436.2%Structure Fires
- 1,30314.4%Mobile Property/Vehicle Fires
- 4454.9%Other
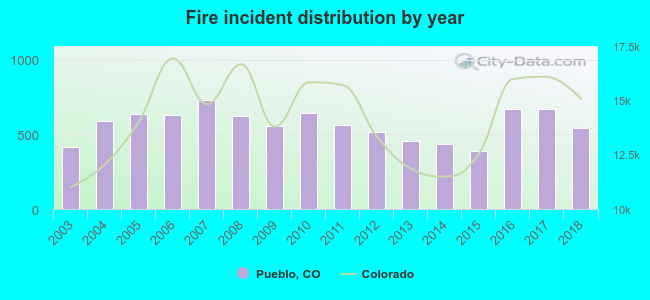 According to the data from the years 2003 - 2018 the average number of fire incidents per year is 567. The highest number of reported fire incidents - 728 took place in 2007, and the least - 388 in 2015. The data has a rising trend.
The average number of yearly fire incidents per 10k residents in Pueblo, CO compared to nearest cities:
(Note: Based on data for the last 3 years, including only cities with population 5,000 and above)
| Pueblo: | 58.0 |
| Pueblo West: | 9.0 |
| Fountain: | 60.1 |
| Fort Carson: | 9.7 |
| Canon City: | 49.6 |
| Southeastern El Paso: | 0.8 |
| Stratmoor: | 1.4 |
| Cimarron Hills: | 8.7 |
| Colorado Springs: | 17.3 |
 The median response time based on all reported fire incidents is 6 minutes. This is similar to the Colorado median value.
The median response time in Pueblo, CO compared to nearest cities:
(Note: Based on data for all years, including only cities with at least 500 fire incidents)
| Pueblo: | 6 minutes |
| Pueblo West: | 7 minutes |
| Fountain: | 5 minutes |
| Canon City: | 6 minutes |
| Colorado Springs: | 6 minutes |
| Rocky Ford: | 5 minutes |
| Peyton: | 12 minutes |
| Woodland Park: | 9 minutes |
| Calhan: | 17 minutes |
 According to the reports from the years 2003 - 2018 the average number of fire-related fatalities per year is 1. The highest number of deaths - 5 took place in 2012, and the lowest - 0 in 2003. The data has a rising trend.
The average number of deaths per 1,000 fire incidents is 2. This indicator was the highest - 10 in 2012, and the lowest 0 in 2003. The trend for fatalities per 1,000 fires is rising. Compared to the Colorado value the number of deaths per 1,000 fire incidents is higher.
According to the reports from the years 2003 - 2018 the average number of fire-related fatalities per year is 1. The highest number of deaths - 5 took place in 2012, and the lowest - 0 in 2003. The data has a rising trend.
The average number of deaths per 1,000 fire incidents is 2. This indicator was the highest - 10 in 2012, and the lowest 0 in 2003. The trend for fatalities per 1,000 fires is rising. Compared to the Colorado value the number of deaths per 1,000 fire incidents is higher.Deaths per 1,000 incidents in Pueblo, CO compared to nearest cities:
(Note: Based on data for all years, including only cities with at least 2,500 fire incidents)
| Pueblo: | 2.2 |
| Colorado Springs: | 1.8 |
 According to the reports from the years 2003 - 2018 the average number of fire-related yearly casualties is 9. The highest number of injuries - 17 took place in 2010, and the lowest - 1 in 2006. The data has a dropping trend.
The average number of injuries per 1,000 fires is 17. This indicator was the highest - 41 in 2015, and the lowest 2 in 2006. The trend for casualties per 1,000 fire incidents is dropping. Compared to the Colorado value the number of casualties per 1,000 incidents is higher.
According to the reports from the years 2003 - 2018 the average number of fire-related yearly casualties is 9. The highest number of injuries - 17 took place in 2010, and the lowest - 1 in 2006. The data has a dropping trend.
The average number of injuries per 1,000 fires is 17. This indicator was the highest - 41 in 2015, and the lowest 2 in 2006. The trend for casualties per 1,000 fire incidents is dropping. Compared to the Colorado value the number of casualties per 1,000 incidents is higher.Casualties per 1,000 incidents in Pueblo, CO compared to nearest cities:
(Note: Based on data for all years, including only cities with at least 500 fire incidents)
| Pueblo: | 16.5 |
| Pueblo West: | 9.7 |
| Fountain: | 21.8 |
| Canon City: | 17.9 |
| Colorado Springs: | 23.3 |
| Rocky Ford: | 0.0 |
| Peyton: | 6.4 |
| Woodland Park: | 3.9 |
| Calhan: | 7.2 |
 30.1% incidents where reported in the morning and 69.9% in the evening. The most fires (15.7%) took place on Saturday, and the least (13.5%) on Wednesday.
 According to the 9,071 fire incidents from years 2003 - 2018 most fires (11.8%) took place during July, and the least (6.7%) in January.
 Out of all 111,961 cases reported during the years 2003 - 2018, the most belonged to the categories: Rescue & EMS (58.2%), Good Intent Call (13.9%), and Fire (8.1%).
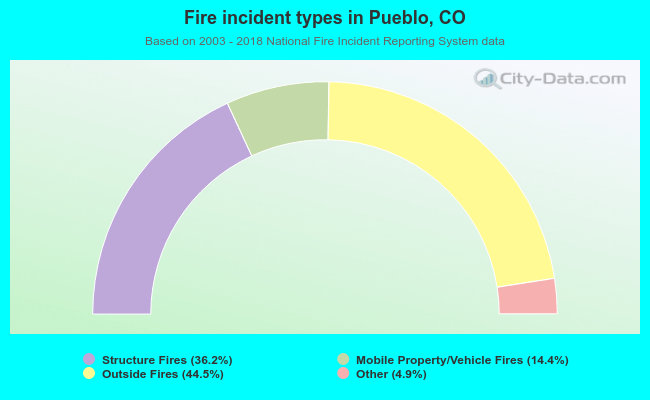 When looking into fire subcategories, the most incidents belonged to: Outside Fires (44.5%), and Structure Fires (36.2%).