Duvall: Fire Incidents, Washington (WA)
Where are fire incidents reported in Duvall, WA
Something went wrong! Please refresh the page.
|
| |||||||||||||||||||||||||||||||||||||||||||||||||||||||||||||||||||||||||||||||||||||||||||||||||||||||||||||
2002 - 2018 National Fire Incident Reporting System (NFIRS) incidents
- Incident types reported to NFIRS in Duvall, WA
- 2,11559.8%Rescue & EMS
- 38610.9%Fire
- 36210.2%Good Intent Call
- 2647.5%Hazardous Condition
- 2216.3%Service Call
- 1744.9%False Alarm
- 70.2%Special Incident
- Fire incident types reported to NFIRS in Duvall, WA
- 17545.3%Structure Fires
- 13334.5%Outside Fires
- 4611.9%Mobile Property/Vehicle Fires
- 328.3%Other
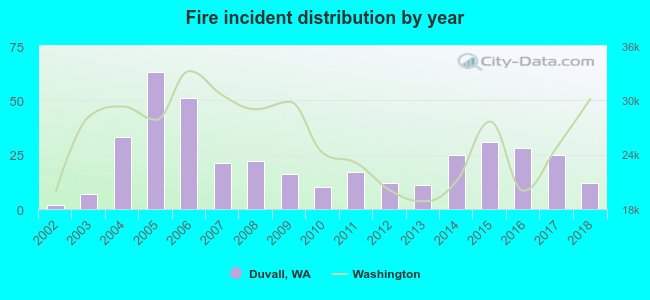 According to the data from the years 2002 - 2018 the average number of fires per year is 23. The highest number of reported fire incidents - 63 took place in 2005, and the least - 2 in 2002. The data has an increasing trend.
The average number of yearly fire incidents per 10k residents in Duvall, WA compared to nearest cities:
(Note: Based on data for the last 3 years, including only cities with population 5,000 and above)
| Duvall: | 28.4 |
| Redmond: | 21.2 |
| Woodinville: | 16.1 |
| Monroe: | 19.6 |
| Sammamish: | 11.3 |
| Kirkland: | 6.4 |
| Bothell: | 32.5 |
| Kenmore: | 14.5 |
| Bellevue: | 26.4 |
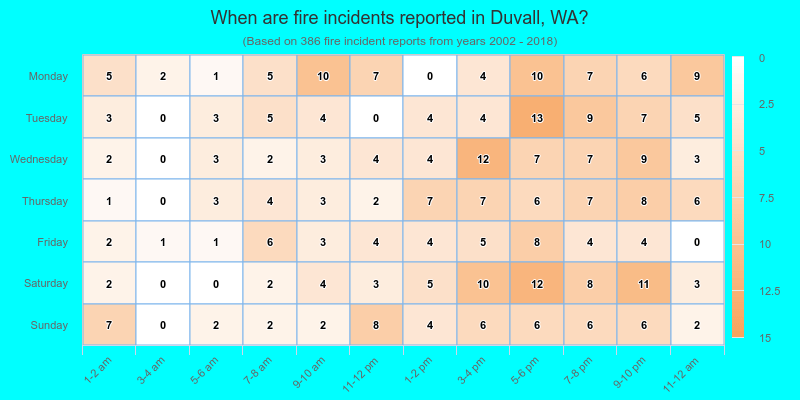
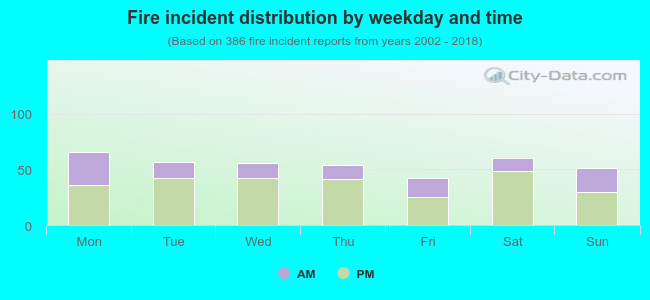 31.3% incidents where reported in the morning and 68.7% in the evening. The most fires (17.1%) took place on Monday, and the least (10.9%) on Friday.
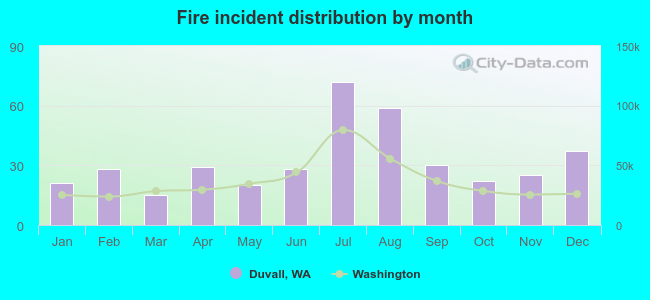 According to the 386 fires from years 2002 - 2018 most fires (18.7%) took place during July, and the least (3.9%) in March.
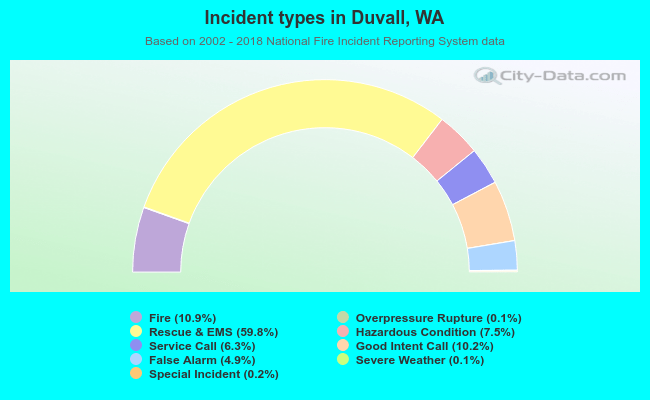 Out of all 3,535 cases reported during the years 2002 - 2018, the most belonged to the categories: Rescue & EMS (59.8%), Fire (10.9%), and Good Intent Call (10.2%).
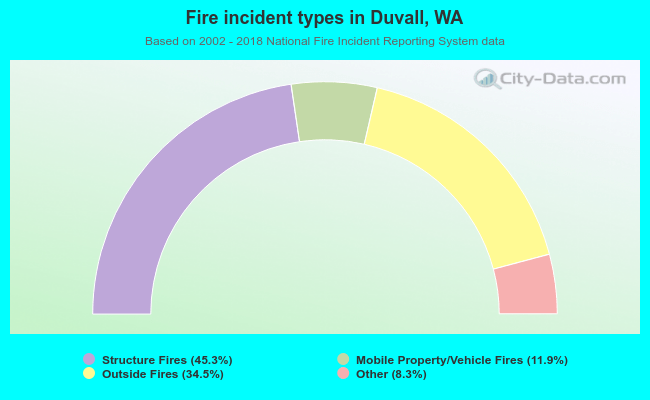 When looking into fire subcategories, the most incidents belonged to: Structure Fires (45.3%), and Outside Fires (34.5%).