East Moline: Fire Incidents, Illinois (IL)
Where are fire incidents reported in East Moline, IL
Something went wrong! Please refresh the page.
| Fire incidents reported | |
|---|---|
| Sreet name | Count |
| AVENUE OF THE CITIES | 120 |
| 7TH ST | 84 |
| 19TH ST | 54 |
| 12TH ST | 52 |
| 13TH AVE | 44 |
| ARCHER DR | 44 |
| 13TH ST | 42 |
| 15TH AVE | 42 |
| KENNEDY DR | 42 |
| 16TH AVE | 40 |
| 16TH AV | 38 |
| 17TH ST | 38 |
| 15TH AV | 36 |
| 13TH AV | 34 |
| 18TH ST | 34 |
| 42ND AVE | 34 |
| MORTON DR | 34 |
| 20TH ST | 30 |
| 21ST ST | 30 |
| 4TH AV | 30 |
| 51ST AV | 30 |
| 20TH AVE | 28 |
| 5TH ST | 28 |
| 11TH ST | 26 |
| 1ST AV | 26 |
| 30TH AV | 26 |
| BARSTOW RD | 26 |
| 17TH AV | 24 |
| 10TH AVE | 22 |
| 10TH ST | 22 |
| Other | 164 |
2002 - 2018 National Fire Incident Reporting System (NFIRS) incidents
- Incident types reported to NFIRS in East Moline, IL
- 9,68569.4%Rescue & EMS
- 1,3249.5%Fire
- 9236.6%Good Intent Call
- 8866.3%Service Call
- 6014.3%Hazardous Condition
- 4903.5%False Alarm
- 270.2%Special Incident
- Fire incident types reported to NFIRS in East Moline, IL
- 51438.8%Outside Fires
- 46134.8%Structure Fires
- 22016.6%Mobile Property/Vehicle Fires
- 1299.7%Other
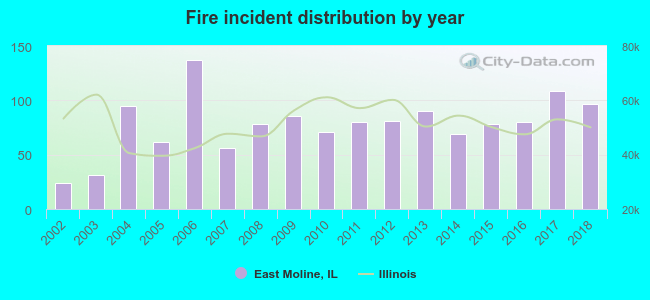 According to the data from the years 2002 - 2018 the average number of fires per year is 78. The highest number of fire incidents - 137 took place in 2006, and the least - 24 in 2002. The data has a growing trend.
The average number of yearly fire incidents per 10k residents in East Moline, IL compared to nearest cities:
(Note: Based on data for the last 3 years, including only cities with population 5,000 and above)
| East Moline: | 45.0 |
| Silvis: | 30.1 |
| Moline: | 25.3 |
| Colona: | 119.0 |
| Rock Island: | 24.4 |
| Milan: | 66.6 |
| Geneseo: | 44.9 |
| Kewanee: | 50.0 |
 The median response time based on all reported fire incidents is 5 minutes. This is similar to the Illinois median value.
The median response time in East Moline, IL compared to nearest cities:
(Note: Based on data for all years, including only cities with at least 500 fire incidents)
| East Moline: | 5 minutes |
| Moline: | 5 minutes |
| Colona: | 6 minutes |
| Rock Island: | 4 minutes |
| Milan: | 8 minutes |
| Geneseo: | 8 minutes |
| Morrison: | 7 minutes |
| Kewanee: | 3 minutes |
 According to the reports from the years 2002 - 2018 the average number of fire-related yearly deaths is 0. The highest number of deaths - 2 took place in 2006, and the lowest - 0 in 2002. The data has an increasing trend.
 Based on the data from the years 2002 - 2018 the average number of fire-related yearly casualties is 1. The highest number of reported casualties - 1 took place in 2002, and the lowest - 0 in 2003. The data has a constant trend.
The average number of casualties per 1,000 fire incidents is 8. This indicator was the highest - 42 in 2002, and the lowest 0 in 2003. The trend for injuries per 1,000 incidents is decreasing. Compared to the state value the number of casualties per 1,000 fires is lower.
Based on the data from the years 2002 - 2018 the average number of fire-related yearly casualties is 1. The highest number of reported casualties - 1 took place in 2002, and the lowest - 0 in 2003. The data has a constant trend.
The average number of casualties per 1,000 fire incidents is 8. This indicator was the highest - 42 in 2002, and the lowest 0 in 2003. The trend for injuries per 1,000 incidents is decreasing. Compared to the state value the number of casualties per 1,000 fires is lower.
 35.6% incidents where reported in the morning and 64.4% in the evening. The most fires (15.4%) took place on Friday, and the least (12.9%) on Thursday.
 According to the 1,324 fire incidents from years 2002 - 2018 most fires (12.2%) took place during April, and the least (5.8%) in September.
 Out of all 13,954 cases reported during the years 2002 - 2018, the most belonged to the categories: Rescue & EMS (69.4%), Fire (9.5%), and Good Intent Call (6.6%).
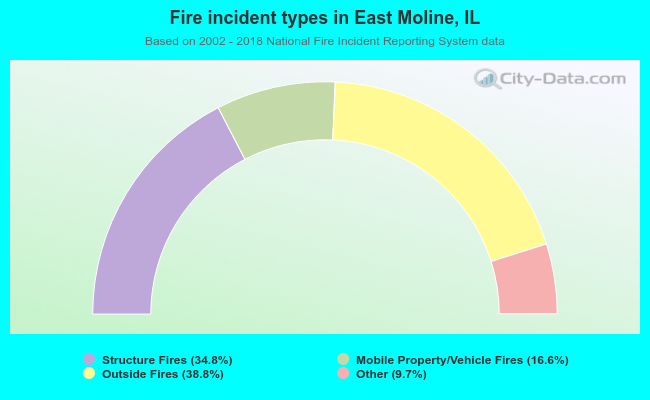 When looking into fire subcategories, the most reports belonged to: Outside Fires (38.8%), and Structure Fires (34.8%).