Moline: Fire Incidents, Illinois (IL)
Where are fire incidents reported in Moline, IL
Something went wrong! Please refresh the page.
| Fire incidents reported | |
|---|---|
| Sreet name | Count |
| AVENUE OF THE CITIES | 128 |
| 15TH ST | 108 |
| 6TH AV | 84 |
| 16TH ST | 72 |
| 16 ST | 64 |
| 15 ST | 62 |
| 41ST ST | 46 |
| 17TH ST | 44 |
| 12TH ST | 40 |
| 27TH ST | 40 |
| 18TH AV | 36 |
| 5TH AV | 36 |
| 48TH ST | 34 |
| 53RD ST | 34 |
| JOHN DEERE RD | 34 |
| RIVER DRIVE | 34 |
| 11 AVE | 32 |
| 7TH ST | 32 |
| 19TH ST | 30 |
| 60TH ST | 30 |
| 12 ST | 28 |
| 12TH AV | 28 |
| 16TH AV | 28 |
| 27 ST | 28 |
| 41 ST | 28 |
| 48 ST | 28 |
| 5 AV | 28 |
| 53 ST | 28 |
| 6TH AV | 28 |
| 70TH ST | 28 |
| Other | 819 |
2003 - 2018 National Fire Incident Reporting System (NFIRS) incidents
- Incident types reported to NFIRS in Moline, IL
- 15,88654.3%Rescue & EMS
- 5,02617.2%Good Intent Call
- 3,34911.4%Service Call
- 2,1197.2%Fire
- 1,4164.8%False Alarm
- 1,3654.7%Hazardous Condition
- 340.1%Overpressure Rupture
- 320.1%Special Incident
- Fire incident types reported to NFIRS in Moline, IL
- 89242.1%Structure Fires
- 64530.4%Outside Fires
- 47622.5%Mobile Property/Vehicle Fires
- 1065.0%Other
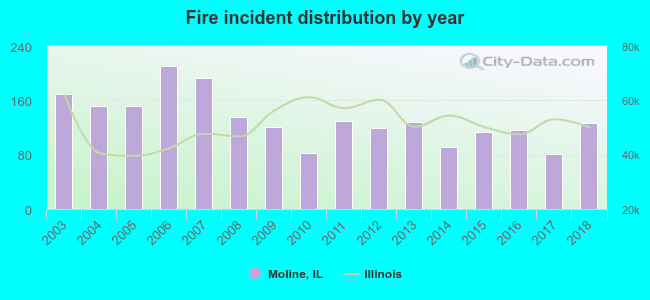 Based on the data from the years 2003 - 2018 the average number of fires per year is 132. The highest number of reported fires - 210 took place in 2006, and the least - 81 in 2017. The data has a dropping trend.
The average number of yearly fire incidents per 10k residents in Moline, IL compared to nearest cities:
(Note: Based on data for the last 3 years, including only cities with population 5,000 and above)
| Moline: | 25.3 |
| Rock Island: | 24.4 |
| East Moline: | 45.0 |
| Milan: | 66.6 |
| Silvis: | 30.1 |
| Colona: | 119.0 |
| Geneseo: | 44.9 |
 The median response time based on all reported fire incidents is 5 minutes. This is similar to the state median value.
The median response time in Moline, IL compared to nearest cities:
(Note: Based on data for all years, including only cities with at least 500 fire incidents)
| Moline: | 5 minutes |
| Rock Island: | 4 minutes |
| East Moline: | 5 minutes |
| Milan: | 8 minutes |
| Colona: | 6 minutes |
| Geneseo: | 8 minutes |
 According to the reports from the years 2003 - 2018 the average number of fire-related yearly deaths is 1. The highest number of deaths - 3 took place in 2007, and the lowest - 0 in 2003. The data has a constant trend.
 According to the reports from the years 2003 - 2018 the average number of fire-related yearly casualties is 2. The highest number of reported casualties - 8 took place in 2013, and the lowest - 0 in 2005. The data has a declining trend.
The average number of casualties per 1,000 fires is 13. This indicator was the highest - 63 in 2013, and the lowest 0 in 2005. The trend for casualties per 1,000 fire incidents is dropping. Compared to the state value the number of injuries per 1,000 incidents is similar.
According to the reports from the years 2003 - 2018 the average number of fire-related yearly casualties is 2. The highest number of reported casualties - 8 took place in 2013, and the lowest - 0 in 2005. The data has a declining trend.
The average number of casualties per 1,000 fires is 13. This indicator was the highest - 63 in 2013, and the lowest 0 in 2005. The trend for casualties per 1,000 fire incidents is dropping. Compared to the state value the number of injuries per 1,000 incidents is similar.Casualties per 1,000 incidents in Moline, IL compared to nearest cities:
(Note: Based on data for all years, including only cities with at least 500 fire incidents)
| Moline: | 12.3 |
| Rock Island: | 4.0 |
| East Moline: | 6.8 |
| Milan: | 0.0 |
| Colona: | 0.0 |
| Geneseo: | 0.0 |
 31.2% incidents where reported in the morning and 68.8% in the evening. The most fires (15.7%) took place on Saturday, and the least (13.4%) on Wednesday.
 According to the 2,119 fires from years 2003 - 2018 most fires (11.3%) took place during July, and the least (5.4%) in December.
 Out of all 29,256 cases reported during the years 2003 - 2018, the most belonged to the categories: Rescue & EMS (54.3%), Good Intent Call (17.2%), and Service Call (11.4%).
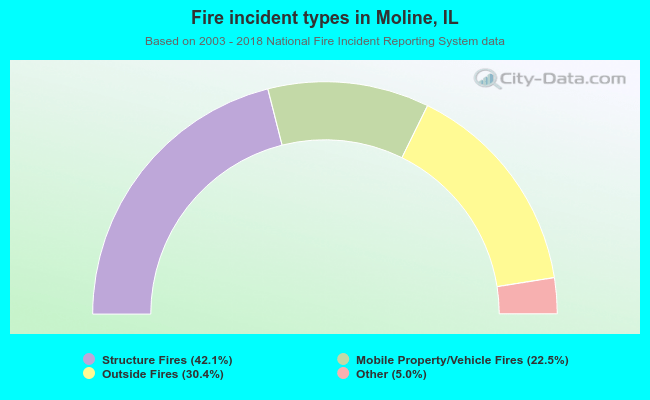 When looking into fire subcategories, the most incidents belonged to: Structure Fires (42.1%), and Outside Fires (30.4%).