Milan: Fire Incidents, Illinois (IL)
Where are fire incidents reported in Milan, IL
Something went wrong! Please refresh the page.
|
| |||||||||||||||||||||||||||||||||||||||||||||||||||||||||||||||||||||||||||||||||||||||||||||||||||||||||||||
| Other | 228 | |||||||||||||||||||||||||||||||||||||||||||||||||||||||||||||||||||||||||||||||||||||||||||||||||||||||||||||
2002 - 2018 National Fire Incident Reporting System (NFIRS) incidents
- Incident types reported to NFIRS in Milan, IL
- 2,97670.0%Rescue & EMS
- 59614.0%Fire
- 3207.5%Good Intent Call
- 1603.8%Hazardous Condition
- 1082.5%False Alarm
- 711.7%Service Call
- 110.3%Severe Weather
- 70.2%Overpressure Rupture
- Fire incident types reported to NFIRS in Milan, IL
- 25542.8%Outside Fires
- 17629.5%Structure Fires
- 9415.8%Mobile Property/Vehicle Fires
- 7111.9%Other
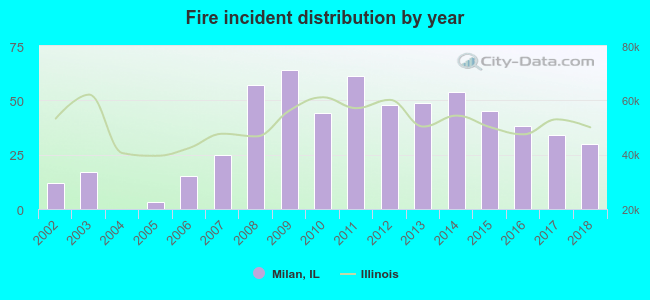 Based on the data from the years 2002 - 2018 the average number of fires per year is 35. The highest number of fires - 64 took place in 2009, and the least - 0 in 2004. The data has a rising trend.
The average number of yearly fire incidents per 10k residents in Milan, IL compared to nearest cities:
(Note: Based on data for the last 3 years, including only cities with population 5,000 and above)
| Milan: | 66.6 |
| Rock Island: | 24.4 |
| Moline: | 25.3 |
| East Moline: | 45.0 |
| Silvis: | 30.1 |
| Colona: | 119.0 |
| Geneseo: | 44.9 |
 The median response time based on all reported fire incidents is 8 minutes. This is higher compared to the state median value.
The median response time in Milan, IL compared to nearest cities:
(Note: Based on data for all years, including only cities with at least 500 fire incidents)
| Milan: | 8 minutes |
| Rock Island: | 4 minutes |
| Moline: | 5 minutes |
| East Moline: | 5 minutes |
| Colona: | 6 minutes |
| Geneseo: | 8 minutes |
 27.5% incidents where reported in the morning and 72.5% in the evening. The most fires (15.9%) took place on Saturday, and the least (11.4%) on Thursday.
 Based on the 596 fires from years 2002 - 2018 most fires (14.4%) took place during April, and the least (4.4%) in December.
 Out of all 4,251 cases reported during the years 2002 - 2018, the most belonged to the categories: Rescue & EMS (70.0%), Fire (14.0%), and Good Intent Call (7.5%).
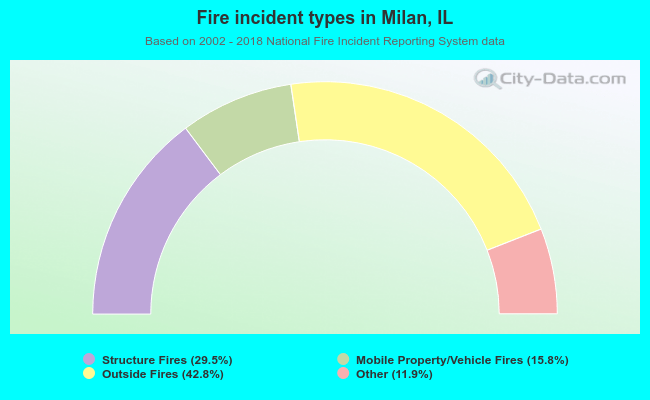 When looking into fire subcategories, the most reports belonged to: Outside Fires (42.8%), and Structure Fires (29.5%).