Rayne: Fire Incidents, Louisiana (LA)
Where are fire incidents reported in Rayne, LA
Something went wrong! Please refresh the page.
|
| |||||||||||||||||||||||||||||||||||||||||||||||||||||||||||||||||||||||||||||||||||||||||||||||||||||||||||||
2002 - 2018 National Fire Incident Reporting System (NFIRS) incidents
- Incident types reported to NFIRS in Rayne, LA
- 60832.8%Fire
- 43523.5%Rescue & EMS
- 32717.6%Hazardous Condition
- 31116.8%Good Intent Call
- 1437.7%False Alarm
- 211.1%Service Call
- 40.2%Overpressure Rupture
- 40.2%Severe Weather
- Fire incident types reported to NFIRS in Rayne, LA
- 29047.7%Outside Fires
- 20233.2%Structure Fires
- 8914.6%Mobile Property/Vehicle Fires
- 274.4%Other
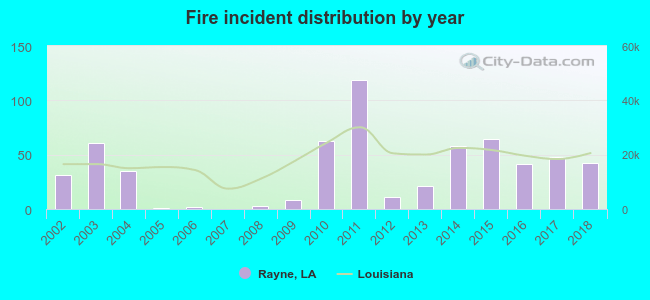 According to the data from the years 2002 - 2018 the average number of fire incidents per year is 36. The highest number of reported fires - 119 took place in 2011, and the least - 0 in 2007. The data has a growing trend.
The average number of yearly fire incidents per 10k residents in Rayne, LA compared to nearest cities:
(Note: Based on data for the last 3 years, including only cities with population 5,000 and above)
| Rayne: | 54.3 |
| Crowley: | 64.4 |
| Scott: | 94.7 |
| Lafayette: | 36.2 |
| Carencro: | 113.6 |
| Youngsville: | 83.6 |
| Broussard: | 79.8 |
| Eunice: | 91.6 |
| Abbeville: | 97.2 |
 The median response time based on all reported fire incidents is 6 minutes. This is comparable to the state median value.
The median response time in Rayne, LA compared to nearest cities:
(Note: Based on data for all years, including only cities with at least 500 fire incidents)
| Rayne: | 6 minutes |
| Duson: | 8 minutes |
| Crowley: | 3 minutes |
| Scott: | 9 minutes |
| Church Point: | 7 minutes |
| Lafayette: | 5 minutes |
| Carencro: | 8 minutes |
| Kaplan: | 6 minutes |
| Youngsville: | 7 minutes |
 29.3% incidents where reported in the morning and 70.7% in the evening. The most fires (16.1%) took place on Wednesday, and the least (12.5%) on Friday.
 According to the 608 fire incidents from years 2002 - 2018 most fires (11.3%) took place during May, and the least (5.1%) in April.
 Out of all 1,853 cases reported during the years 2002 - 2018, the most belonged to the categories: Fire (32.8%), Rescue & EMS (23.5%), and Hazardous Condition (17.6%).
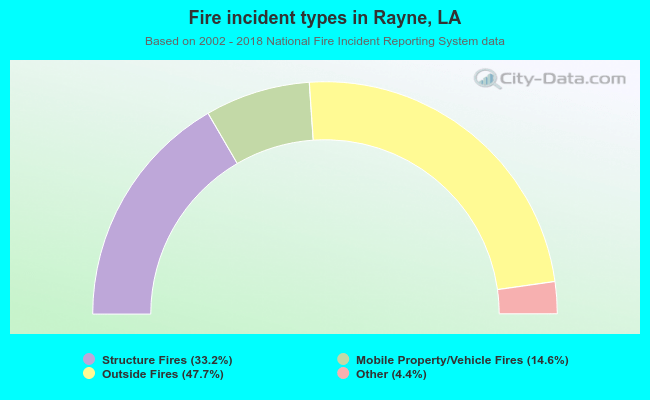 When looking into fire subcategories, the most reports belonged to: Outside Fires (47.7%), and Structure Fires (33.2%).