Crowley: Fire Incidents, Louisiana (LA)
Where are fire incidents reported in Crowley, LA
Something went wrong! Please refresh the page.
| Fire incidents reported | |
|---|---|
| Sreet name | Count |
| HUTCHINSON AVE | 126 |
| PARKERSON AVE | 72 |
| PARKERSON | 64 |
| CROWLEY RAYNE HWY | 56 |
| ODDFELLOWS RD | 54 |
| EASTERN AVE | 52 |
| 2ND ST | 50 |
| NORTHERN AVE | 50 |
| LOVELL ST | 48 |
| 7TH ST | 46 |
| 9TH ST | 46 |
| CROWLEY EUNICE HWY | 46 |
| 4TH ST | 44 |
| WESTERN AVE | 44 |
| CEDAR ST | 42 |
| 11TH ST | 38 |
| AVE. F | 38 |
| 10TH ST | 36 |
| 5TH ST | 34 |
| 8TH ST | 32 |
| HWY 13 | 30 |
| 14TH ST | 28 |
| ELM ST | 28 |
| MILL ST | 28 |
| ROSS AVE | 28 |
| STANDARD MILL RD | 28 |
| AVE. I | 26 |
| HWY 90 | 26 |
| JACOB AVE | 26 |
| 12TH ST | 24 |
| Other | 261 |
2002 - 2018 National Fire Incident Reporting System (NFIRS) incidents
- Incident types reported to NFIRS in Crowley, LA
- 1,55136.6%Fire
- 1,29430.5%Hazardous Condition
- 58613.8%Rescue & EMS
- 46811.0%False Alarm
- 1794.2%Good Intent Call
- 842.0%Service Call
- 771.8%Overpressure Rupture
- Fire incident types reported to NFIRS in Crowley, LA
- 57537.1%Structure Fires
- 57136.8%Outside Fires
- 33521.6%Mobile Property/Vehicle Fires
- 704.5%Other
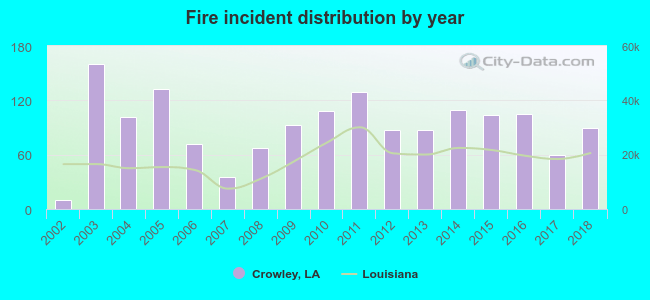 Based on the data from the years 2002 - 2018 the average number of fires per year is 91. The highest number of reported fire incidents - 160 took place in 2003, and the least - 10 in 2002. The data has a growing trend.
The average number of yearly fire incidents per 10k residents in Crowley, LA compared to nearest cities:
(Note: Based on data for the last 3 years, including only cities with population 5,000 and above)
| Crowley: | 64.4 |
| Rayne: | 54.3 |
| Scott: | 94.7 |
| Jennings: | 52.0 |
| Eunice: | 91.6 |
| Lafayette: | 36.2 |
| Carencro: | 113.6 |
| Abbeville: | 97.2 |
| Youngsville: | 83.6 |
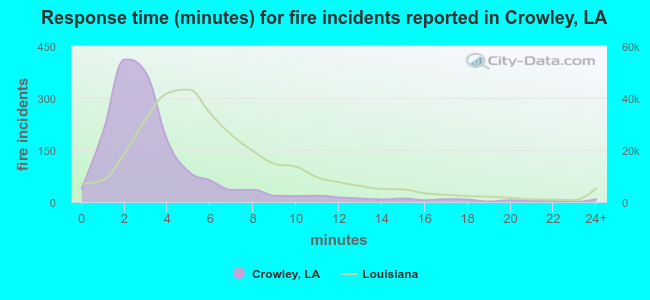 The median response time based on all reported fire incidents is 3 minutes. This is much lower compared to the Louisiana median value.
The median response time in Crowley, LA compared to nearest cities:
(Note: Based on data for all years, including only cities with at least 500 fire incidents)
| Crowley: | 3 minutes |
| Rayne: | 6 minutes |
| Duson: | 8 minutes |
| Kaplan: | 6 minutes |
| Church Point: | 7 minutes |
| Scott: | 9 minutes |
| Jennings: | 9 minutes |
| Eunice: | 4 minutes |
| Lafayette: | 5 minutes |
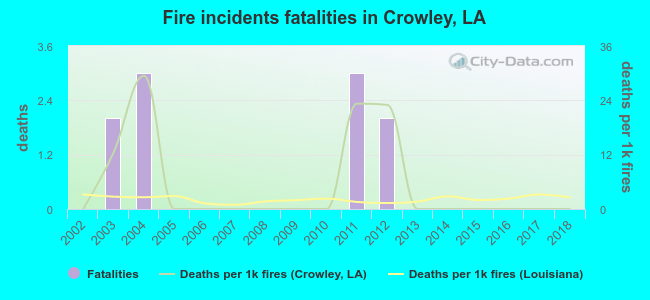 According to the reports from the years 2002 - 2018 the average number of fire-related yearly deaths is 1. The highest number of deaths - 3 took place in 2004, and the lowest - 0 in 2002. The data has a constant trend.
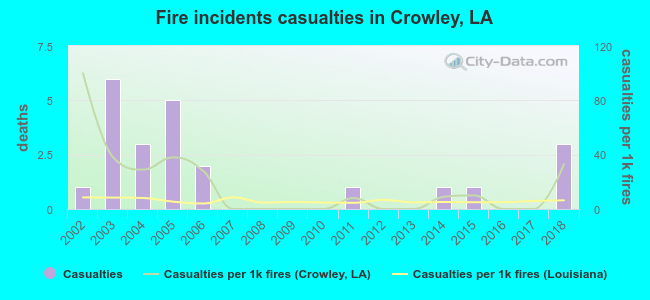 Based on the data from the years 2002 - 2018 the average number of fire-related casualties per year is 1. The highest number of casualties - 6 took place in 2003, and the lowest - 0 in 2007. The data has an increasing trend.
The average number of injuries per 1,000 fires is 17. This indicator was the highest - 100 in 2002, and the lowest 0 in 2007. The trend for injuries per 1,000 fires is dropping. Compared to the state value the number of injuries per 1,000 fires is much higher.
Based on the data from the years 2002 - 2018 the average number of fire-related casualties per year is 1. The highest number of casualties - 6 took place in 2003, and the lowest - 0 in 2007. The data has an increasing trend.
The average number of injuries per 1,000 fires is 17. This indicator was the highest - 100 in 2002, and the lowest 0 in 2007. The trend for injuries per 1,000 fires is dropping. Compared to the state value the number of injuries per 1,000 fires is much higher.
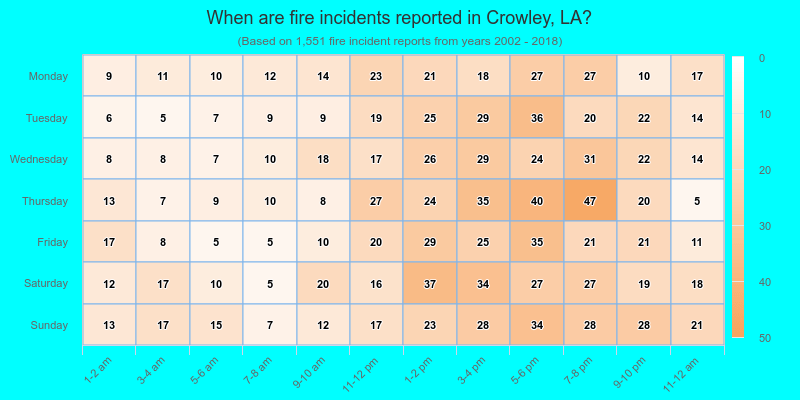
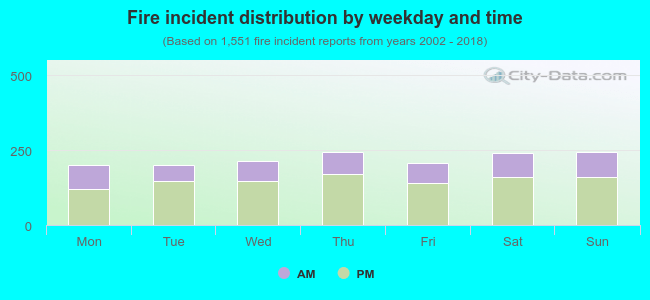 32.4% incidents where reported in the morning and 67.6% in the evening. The most fires (15.8%) took place on Thursday, and the least (12.8%) on Monday.
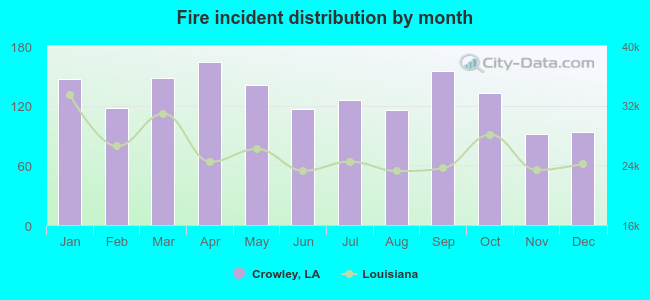 Based on the 1,551 incident reports from years 2002 - 2018 most fires (10.6%) took place during April, and the least (5.9%) in November.
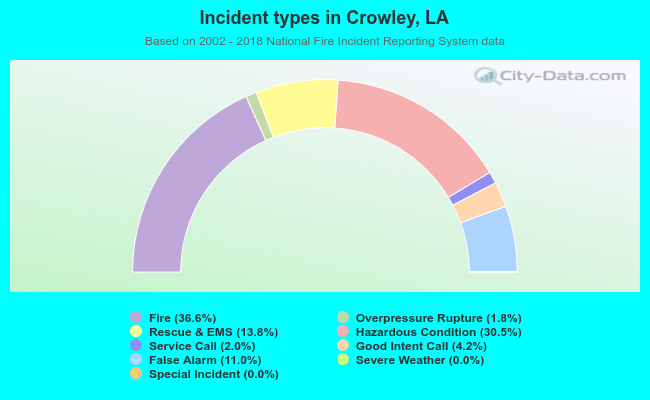 Out of all 4,241 cases reported during the years 2002 - 2018, the most belonged to the categories: Fire (36.6%), Hazardous Condition (30.5%), and Rescue & EMS (13.8%).
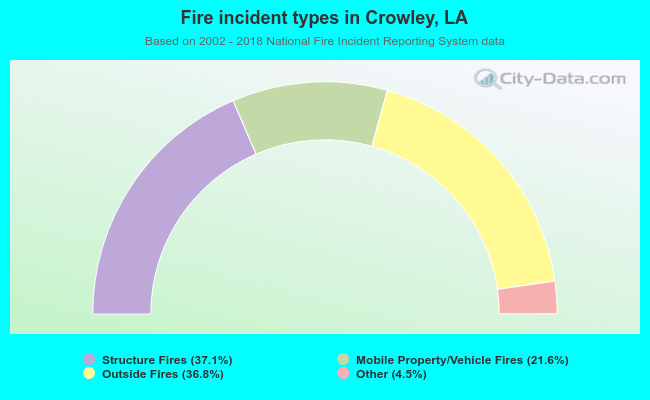 When looking into fire subcategories, the most incidents belonged to: Structure Fires (37.1%), and Outside Fires (36.8%).