Eunice: Fire Incidents, Louisiana (LA)
Where are fire incidents reported in Eunice, LA
Something went wrong! Please refresh the page.
| Fire incidents reported | |
|---|---|
| Sreet name | Count |
| HWY 190 | 154 |
| LAUREL AVE | 108 |
| HWY. 190 | 56 |
| MAPLE | 42 |
| HWY 190 EAST | 40 |
| HWY 95 | 38 |
| HWY 13 HWY | 28 |
| HWY 757 | 28 |
| HWY 91 | 28 |
| CC DUSON ST | 26 |
| BEULAH | 24 |
| FUSELIER ST | 24 |
| MAPLE AVE | 24 |
| PERCHVILLE RD | 24 |
| FOURNERAT RD | 22 |
| LAUREL | 22 |
| MAGNOLIA ST | 22 |
| SECOND ST | 22 |
| C.C. DUSON ST | 20 |
| JOHNSON HWY | 20 |
| PARK | 20 |
| 3RD | 18 |
| ASH ST | 18 |
| AYMOND ST | 18 |
| HWY 13 SOUTH | 18 |
| PARK AVE | 18 |
| SOILEAU RD | 18 |
| VINE ST | 18 |
| ASH | 16 |
| HWY 29 | 16 |
| Other | 922 |
2002 - 2018 National Fire Incident Reporting System (NFIRS) incidents
- Incident types reported to NFIRS in Eunice, LA
- 1,87243.3%Fire
- 81918.9%Hazardous Condition
- 58113.4%Rescue & EMS
- 46810.8%False Alarm
- 3638.4%Good Intent Call
- 1994.6%Service Call
- 110.3%Overpressure Rupture
- 100.2%Special Incident
- Fire incident types reported to NFIRS in Eunice, LA
- 75440.3%Outside Fires
- 62933.6%Structure Fires
- 38120.4%Mobile Property/Vehicle Fires
- 1085.8%Other
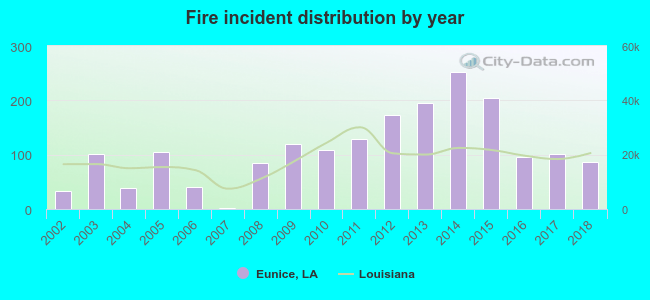 According to the data from the years 2002 - 2018 the average number of fires per year is 110. The highest number of reported fires - 252 took place in 2014, and the least - 1 in 2007. The data has an increasing trend.
The average number of yearly fire incidents per 10k residents in Eunice, LA compared to nearest cities:
(Note: Based on data for the last 3 years, including only cities with population 5,000 and above)
| Eunice: | 91.6 |
| Ville Platte: | 100.2 |
| Crowley: | 64.4 |
| Rayne: | 54.3 |
| Opelousas: | 158.9 |
| Jennings: | 52.0 |
| Carencro: | 113.6 |
| Scott: | 94.7 |
| Oakdale: | 115.7 |
 The median response time based on all reported fire incidents is 4 minutes. This is lower than the Louisiana median value.
The median response time in Eunice, LA compared to nearest cities:
(Note: Based on data for all years, including only cities with at least 500 fire incidents)
| Eunice: | 4 minutes |
| Church Point: | 7 minutes |
| Ville Platte: | 5 minutes |
| Crowley: | 3 minutes |
| Rayne: | 6 minutes |
| Opelousas: | 5 minutes |
| Duson: | 8 minutes |
| Jennings: | 9 minutes |
| Carencro: | 8 minutes |
 According to the reports from the years 2002 - 2018 the average number of fire-related fatalities per year is 1. The highest number of reported deaths - 3 took place in 2015, and the lowest - 0 in 2002. The data has a rising trend.
 According to the data from the years 2002 - 2018 the average number of fire-related casualties per year is 2. The highest number of casualties - 8 took place in 2002, and the lowest - 0 in 2006. The data has a dropping trend.
The average number of casualties per 1,000 fire incidents is 24. This indicator was the highest - 235 in 2002, and the lowest 0 in 2006. The trend for casualties per 1,000 fires is dropping. Compared to the Louisiana value the number of casualties per 1,000 fire incidents is much higher.
According to the data from the years 2002 - 2018 the average number of fire-related casualties per year is 2. The highest number of casualties - 8 took place in 2002, and the lowest - 0 in 2006. The data has a dropping trend.
The average number of casualties per 1,000 fire incidents is 24. This indicator was the highest - 235 in 2002, and the lowest 0 in 2006. The trend for casualties per 1,000 fires is dropping. Compared to the Louisiana value the number of casualties per 1,000 fire incidents is much higher.Casualties per 1,000 incidents in Eunice, LA compared to nearest cities:
(Note: Based on data for all years, including only cities with at least 500 fire incidents)
| Eunice: | 13.9 |
| Church Point: | 0.0 |
| Ville Platte: | 1.0 |
| Crowley: | 14.8 |
| Rayne: | 0.0 |
| Opelousas: | 11.9 |
| Duson: | 0.0 |
| Jennings: | 0.7 |
| Carencro: | 0.0 |
 33.7% incidents where reported in the morning and 66.3% in the evening. The most fires (15.4%) took place on Thursday, and the least (12.6%) on Monday.
 According to the 1,872 fires from years 2002 - 2018 most fires (11.5%) took place during October, and the least (6.2%) in April.
 Out of all 4,324 cases reported during the years 2002 - 2018, the most belonged to the categories: Fire (43.3%), Hazardous Condition (18.9%), and Rescue & EMS (13.4%).
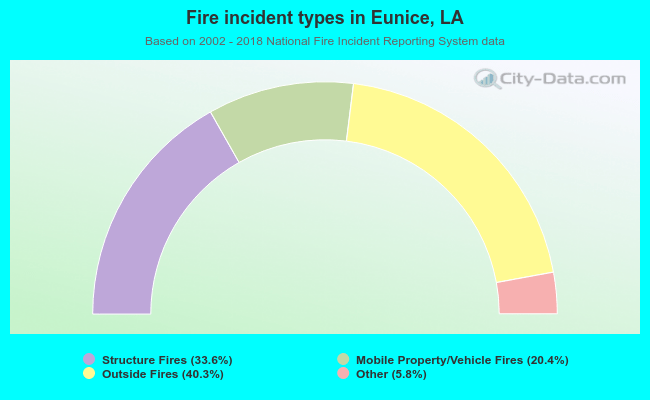 When looking into fire subcategories, the most reports belonged to: Outside Fires (40.3%), and Structure Fires (33.6%).