Snoqualmie: Fire Incidents, Washington (WA)
Where are fire incidents reported in Snoqualmie, WA
Something went wrong! Please refresh the page.
|
| |||||||||||||||||||||||||||||||||||||||||||||||||||||||||||||||||||||||||||||||||||||||||||||||||||||||||||||
2002 - 2018 National Fire Incident Reporting System (NFIRS) incidents
- Incident types reported to NFIRS in Snoqualmie, WA
- 2,97358.9%Rescue & EMS
- 66413.2%Good Intent Call
- 4028.0%Fire
- 3917.7%False Alarm
- 3306.5%Hazardous Condition
- 2725.4%Service Call
- 80.2%Severe Weather
- Fire incident types reported to NFIRS in Snoqualmie, WA
- 24460.7%Structure Fires
- 9724.1%Outside Fires
- 4811.9%Mobile Property/Vehicle Fires
- 133.2%Other
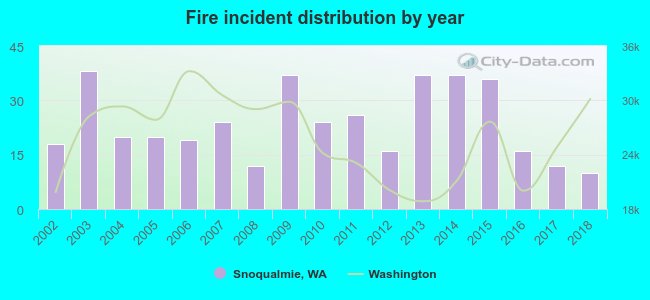 According to the data from the years 2002 - 2018 the average number of fires per year is 24. The highest number of fire incidents - 38 took place in 2003, and the least - 10 in 2018. The data has a decreasing trend.
The average number of yearly fire incidents per 10k residents in Snoqualmie, WA compared to nearest cities:
(Note: Based on data for the last 3 years, including only cities with population 5,000 and above)
| Snoqualmie: | 10.0 |
| North Bend: | 55.2 |
| Issaquah: | 26.1 |
| Sammamish: | 11.3 |
| Maple Valley: | 7.2 |
| Duvall: | 28.4 |
| Newcastle: | 17.9 |
| Bellevue: | 26.4 |
| Redmond: | 21.2 |

 38.3% incidents where reported in the morning and 61.7% in the evening. The most fires (16.2%) took place on Monday, and the least (11.7%) on Sunday.
 According to the 402 fires from years 2002 - 2018 most fires (14.7%) took place during July, and the least (4.5%) in October.
 Out of all 5,047 cases reported during the years 2002 - 2018, the most belonged to the categories: Rescue & EMS (58.9%), Good Intent Call (13.2%), and Fire (8.0%).
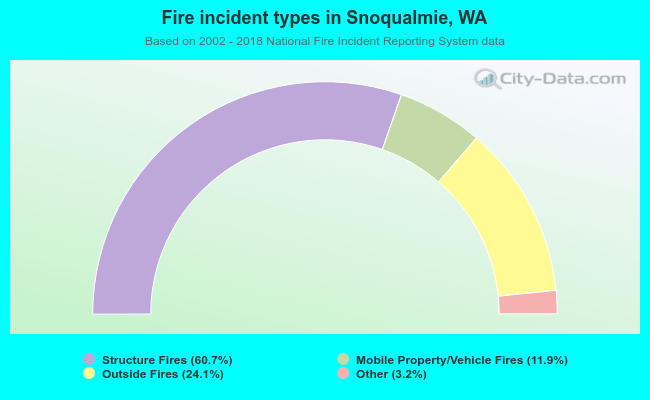 When looking into fire subcategories, the most reports belonged to: Structure Fires (60.7%), and Outside Fires (24.1%).