Washoe Valley: Fire Incidents, Nevada (NV)
Where are fire incidents reported in Washoe Valley, NV
Something went wrong! Please refresh the page.
|
| |||||||||||||||||||||||||||||||||||||||||||||||||||||||||||||||||||||||||||||||||||||||||||||||||||||||||||||
2003 - 2018 National Fire Incident Reporting System (NFIRS) incidents
- Incident types reported to NFIRS in Washoe Valley, NV
- 62246.8%Rescue & EMS
- 23617.8%Good Intent Call
- 16512.4%Fire
- 13310.0%Hazardous Condition
- 13310.0%Service Call
- 312.3%False Alarm
- 80.6%Severe Weather
- Fire incident types reported to NFIRS in Washoe Valley, NV
- 10563.6%Outside Fires
- 3621.8%Mobile Property/Vehicle Fires
- 2112.7%Structure Fires
- 31.8%Other
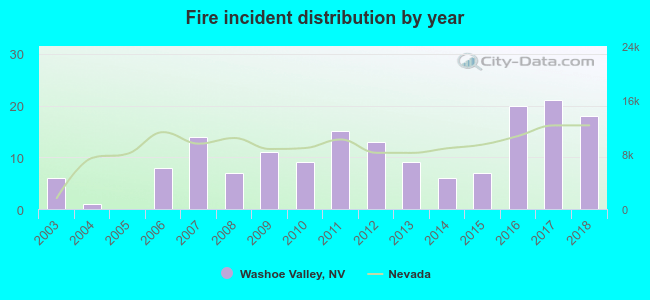 According to the data from the years 2003 - 2018 the average number of fires per year is 10. The highest number of fires - 21 took place in 2017, and the least - 0 in 2005. The data has an increasing trend.
The average number of yearly fire incidents per 10k residents in Washoe Valley, NV compared to nearest cities:
(Note: Based on data for the last 3 years, including only cities with population 5,000 and above)
| Washoe Valley: | 14.4 |
| Incline Village: | 20.3 |
| Carson City: | 28.3 |
| Dayton: | 45.0 |
| Indian Hills: | 1.8 |
| Reno: | 41.0 |
| Sparks: | 38.7 |
| Sun Valley: | 16.9 |
| Zephyr Cove: | 15.2 |

 27.3% incidents where reported in the morning and 72.7% in the evening. The most fires (26.7%) took place on Friday, and the least (9.7%) on Monday.
 Based on the 165 incident reports from years 2003 - 2018 most fires (17.6%) took place during October, and the least (3.6%) in January.
 Out of all 1,328 cases reported during the years 2003 - 2018, the most belonged to the categories: Overpressure Rupture (46.8%), Service Call (17.8%), and Fire (12.4%).
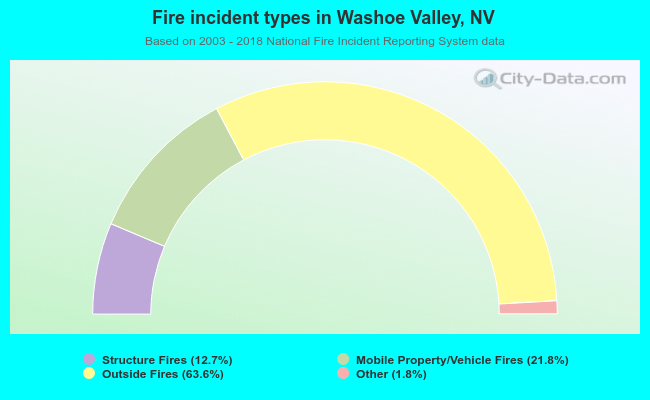 When looking into fire subcategories, the most incidents belonged to: Outside Fires (63.6%), and Mobile Property/Vehicle Fires (21.8%).