Carson City: Fire Incidents, Nevada (NV)
Where are fire incidents reported in Carson City, NV
Something went wrong! Please refresh the page.
| Fire incidents reported | |
|---|---|
| Sreet name | Count |
| CARSON ST | 346 |
| HWY 50 HW | 112 |
| WILLIAM ST | 88 |
| 5TH ST | 74 |
| LONG ST | 72 |
| COLLEGE PY | 56 |
| HWY 50 | 56 |
| HOT SPRINGS RD | 52 |
| CURRY ST | 46 |
| ROOP ST | 42 |
| SALIMAN RD | 42 |
| STEWART ST | 42 |
| WOODSIDE DR | 38 |
| AIRPORT RD | 34 |
| FLINT RD | 34 |
| ARROWHEAD DR | 32 |
| FAIRVIEW DR | 32 |
| JACKS VALLEY RD | 32 |
| KOONTZ LN | 32 |
| EDMONDS DR | 30 |
| REMOTE LOCATION | 30 |
| TIGER DR | 30 |
| 395 HWY | 26 |
| BROWN ST | 26 |
| BRUNSWICK CANYON RD | 26 |
| SNYDER AV | 26 |
| SUNRIDGE DR | 26 |
| BEVERLY DR | 24 |
| HWY 50 HWY | 24 |
| MICA DR | 24 |
| Other | 1,035 |
2002 - 2018 National Fire Incident Reporting System (NFIRS) incidents
- Incident types reported to NFIRS in Carson City, NV
- 42,19580.6%Rescue & EMS
- 2,5894.9%Fire
- 2,4904.8%Good Intent Call
- 1,7363.3%Service Call
- 1,7223.3%Hazardous Condition
- 1,5102.9%False Alarm
- Fire incident types reported to NFIRS in Carson City, NV
- 1,21246.8%Outside Fires
- 84032.4%Structure Fires
- 40715.7%Mobile Property/Vehicle Fires
- 1305.0%Other
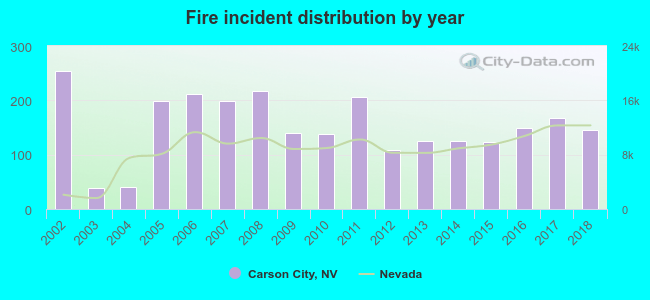 Based on the data from the years 2002 - 2018 the average number of fire incidents per year is 152. The highest number of fires - 254 took place in 2002, and the least - 38 in 2003. The data has a declining trend.
The average number of yearly fire incidents per 10k residents in Carson City, NV compared to nearest cities:
(Note: Based on data for the last 3 years, including only cities with population 5,000 and above)
| Carson City: | 28.3 |
| Indian Hills: | 1.8 |
| Washoe Valley: | 14.4 |
| Incline Village: | 20.3 |
| Dayton: | 45.0 |
| Zephyr Cove: | 15.2 |
| Gardnerville: | 69.5 |
| Gardnerville Ranchos: | 0.9 |
| Reno: | 41.0 |
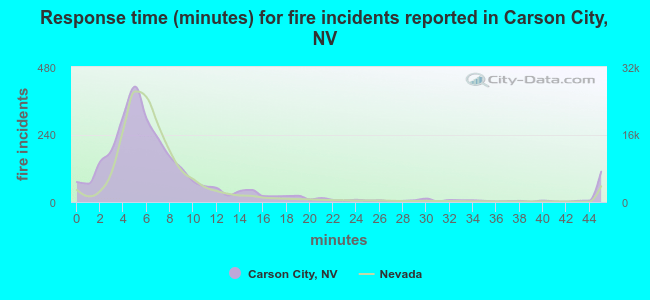 The median response time based on all reported fire incidents is 6 minutes. This is about the same as the state median value.
The median response time in Carson City, NV compared to nearest cities:
(Note: Based on data for all years, including only cities with at least 500 fire incidents)
| Carson City: | 6 minutes |
| Dayton: | 7 minutes |
| Virginia City: | 8 minutes |
| Gardnerville: | 9 minutes |
| Reno: | 7 minutes |
| Sparks: | 6 minutes |
| Yerington: | 9 minutes |
| Fernley: | 9 minutes |
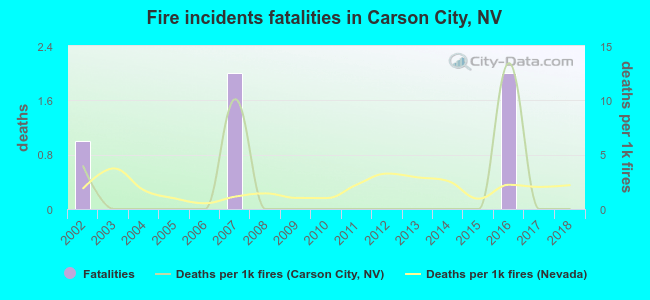 According to the reports from the years 2002 - 2018 the average number of fire-related fatalities per year is 0. The highest number of deaths - 2 took place in 2007, and the lowest - 0 in 2003. The data has a decreasing trend.
The average number of deaths per 1,000 fire incidents is 2. This indicator was the highest - 13 in 2016, and the lowest 0 in 2003. The trend for deaths per 1,000 fire incidents is dropping. Compared to the state value the number of fatalities per 1,000 fires is about the same.
According to the reports from the years 2002 - 2018 the average number of fire-related fatalities per year is 0. The highest number of deaths - 2 took place in 2007, and the lowest - 0 in 2003. The data has a decreasing trend.
The average number of deaths per 1,000 fire incidents is 2. This indicator was the highest - 13 in 2016, and the lowest 0 in 2003. The trend for deaths per 1,000 fire incidents is dropping. Compared to the state value the number of fatalities per 1,000 fires is about the same.
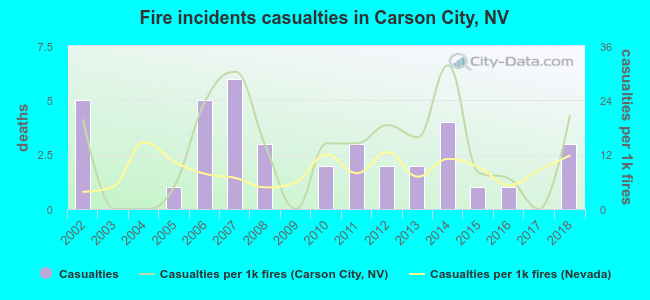 According to the reports from the years 2002 - 2018 the average number of fire-related yearly casualties is 2. The highest number of casualties - 6 took place in 2007, and the lowest - 0 in 2003. The data has a decreasing trend.
The average number of casualties per 1,000 fires is 13. This indicator was the highest - 32 in 2014, and the lowest 0 in 2003. The trend for injuries per 1,000 incidents is growing. Compared to the state value the number of casualties per 1,000 fire incidents is higher.
According to the reports from the years 2002 - 2018 the average number of fire-related yearly casualties is 2. The highest number of casualties - 6 took place in 2007, and the lowest - 0 in 2003. The data has a decreasing trend.
The average number of casualties per 1,000 fires is 13. This indicator was the highest - 32 in 2014, and the lowest 0 in 2003. The trend for injuries per 1,000 incidents is growing. Compared to the state value the number of casualties per 1,000 fire incidents is higher.Casualties per 1,000 incidents in Carson City, NV compared to nearest cities:
(Note: Based on data for all years, including only cities with at least 500 fire incidents)
| Carson City: | 14.7 |
| Dayton: | 10.4 |
| Virginia City: | 0.0 |
| Gardnerville: | 0.0 |
| Reno: | 6.9 |
| Sparks: | 11.4 |
| Yerington: | 3.0 |
| Fernley: | 3.6 |
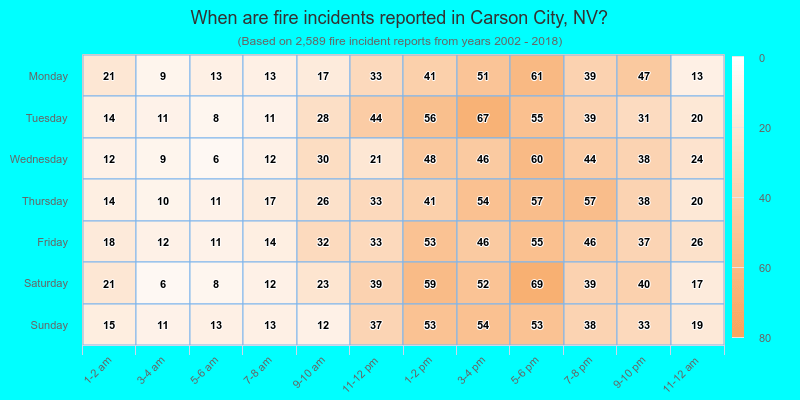
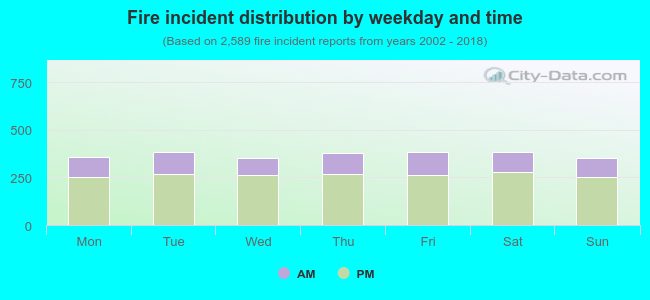 29.1% incidents where reported in the morning and 70.9% in the evening. The most fires (14.9%) took place on Saturday, and the least (13.5%) on Wednesday.
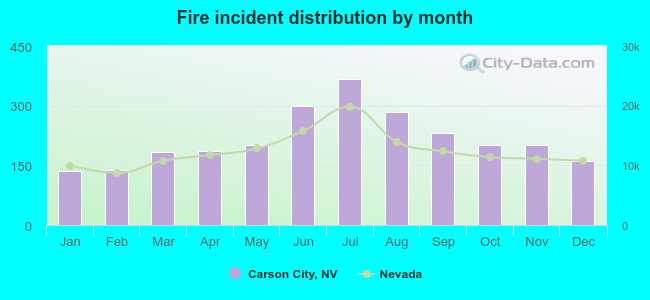 Based on the 2,589 fires from years 2002 - 2018 most fires (14.2%) took place during July, and the least (5.3%) in January.
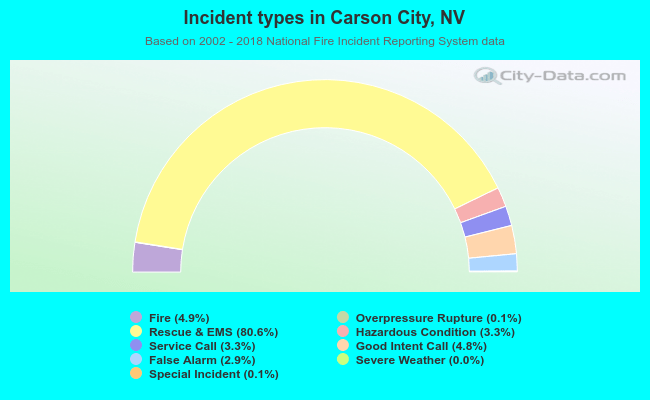 Out of all 52,355 cases reported during the years 2002 - 2018, the most belonged to the categories: Rescue & EMS (80.6%), Fire (4.9%), and Good Intent Call (4.8%).
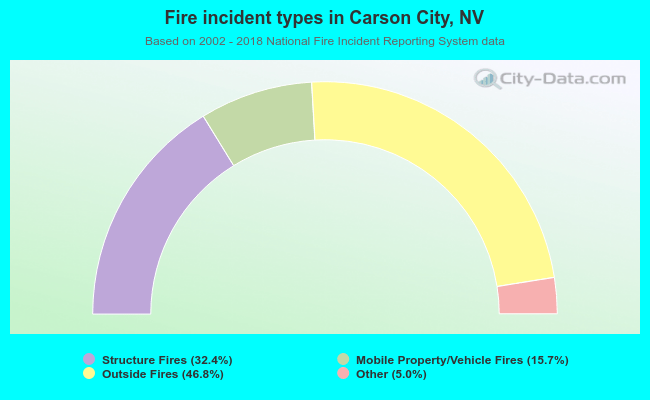 When looking into fire subcategories, the most reports belonged to: Outside Fires (46.8%), and Structure Fires (32.4%).