Reno: Fire Incidents, Nevada (NV)
Where are fire incidents reported in Reno, NV
Something went wrong! Please refresh the page.
| Fire incidents reported | |
|---|---|
| Sreet name | Count |
| VIRGINIA ST | 1,396 |
| 4TH ST | 508 |
| 2ND ST | 356 |
| KIETZKE LN | 330 |
| MCCARRAN BL | 286 |
| KUENZLI ST | 250 |
| WELLS AVE | 214 |
| PLUMB LN | 198 |
| MILL ST | 182 |
| NEIL RD | 182 |
| SUTRO ST | 164 |
| SIERRA ST | 160 |
| 7TH ST | 158 |
| LAKESIDE DR | 158 |
| IDLEWILD DR | 156 |
| PLUMAS ST | 156 |
| WEDEKIND RD | 156 |
| 6TH ST | 154 |
| HARVARD WAY | 144 |
| BRINKBY AVE | 142 |
| NB HY | 142 |
| CENTER ST | 138 |
| 9TH ST | 132 |
| RED ROCK RD | 130 |
| MIRA LOMA DR | 122 |
| SOUTH MEADOWS PW | 122 |
| GENTRY WAY | 118 |
| LEMMON DR | 118 |
| MOANA LN | 116 |
| STEAD BL | 116 |
| Other | 6,031 |
2003 - 2018 National Fire Incident Reporting System (NFIRS) incidents
- Incident types reported to NFIRS in Reno, NV
- 113,55460.9%Rescue & EMS
- 33,27717.8%Good Intent Call
- 12,7356.8%Fire
- 10,2075.5%Hazardous Condition
- 9,4265.1%False Alarm
- 6,8963.7%Service Call
- 2380.1%Special Incident
- Fire incident types reported to NFIRS in Reno, NV
- 5,09440.0%Structure Fires
- 4,69036.8%Outside Fires
- 2,14016.8%Mobile Property/Vehicle Fires
- 8116.4%Other
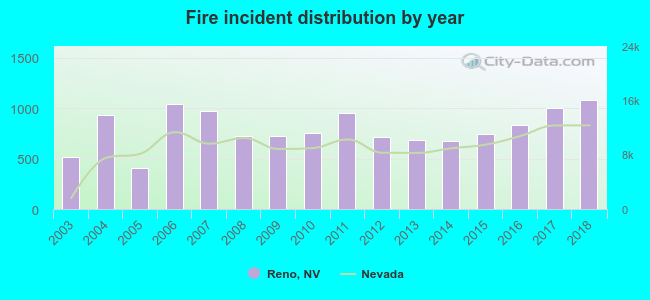 According to the data from the years 2003 - 2018 the average number of fires per year is 796. The highest number of fire incidents - 1,076 took place in 2018, and the least - 410 in 2005. The data has a growing trend.
The average number of yearly fire incidents per 10k residents in Reno, NV compared to nearest cities:
(Note: Based on data for the last 3 years, including only cities with population 5,000 and above)
| Reno: | 41.0 |
| Sparks: | 38.7 |
| Sun Valley: | 16.9 |
| Lemmon Valley: | 2.0 |
| Spanish Springs: | 2.4 |
| Cold Springs: | 5.9 |
| Washoe Valley: | 14.4 |
| Incline Village: | 20.3 |
| Dayton: | 45.0 |
 The median response time based on all reported fire incidents is 7 minutes. This is about the same as the Nevada median value.
The median response time in Reno, NV compared to nearest cities:
(Note: Based on data for all years, including only cities with at least 500 fire incidents)
| Reno: | 7 minutes |
| Sparks: | 6 minutes |
| Virginia City: | 8 minutes |
| Dayton: | 7 minutes |
| Carson City: | 6 minutes |
| Fernley: | 9 minutes |
| Gardnerville: | 9 minutes |
 According to the reports from the years 2003 - 2018 the average number of fire-related fatalities per year is 1. The highest number of reported deaths - 4 took place in 2010, and the lowest - 0 in 2003. The data has a constant trend.
The average number of deaths per 1,000 fire incidents is 2. This indicator was the highest - 6 in 2014, and the lowest 0 in 2003. The trend for fatalities per 1,000 incidents is constant. Compared to the Nevada value the number of fatalities per 1,000 fire incidents is similar.
According to the reports from the years 2003 - 2018 the average number of fire-related fatalities per year is 1. The highest number of reported deaths - 4 took place in 2010, and the lowest - 0 in 2003. The data has a constant trend.
The average number of deaths per 1,000 fire incidents is 2. This indicator was the highest - 6 in 2014, and the lowest 0 in 2003. The trend for fatalities per 1,000 incidents is constant. Compared to the Nevada value the number of fatalities per 1,000 fire incidents is similar.Deaths per 1,000 incidents in Reno, NV compared to nearest cities:
(Note: Based on data for all years, including only cities with at least 2,500 fire incidents)
| Reno: | 1.8 |
| Sparks: | 2.0 |
| Carson City: | 1.9 |
 Based on the data from the years 2003 - 2018 the average number of fire-related casualties per year is 6. The highest number of reported casualties - 13 took place in 2017, and the lowest - 0 in 2003. The data has a rising trend.
The average number of injuries per 1,000 fire incidents is 7. This indicator was the highest - 16 in 2014, and the lowest 0 in 2003. The trend for casualties per 1,000 incidents is increasing. Compared to the state value the number of casualties per 1,000 fire incidents is lower.
Based on the data from the years 2003 - 2018 the average number of fire-related casualties per year is 6. The highest number of reported casualties - 13 took place in 2017, and the lowest - 0 in 2003. The data has a rising trend.
The average number of injuries per 1,000 fire incidents is 7. This indicator was the highest - 16 in 2014, and the lowest 0 in 2003. The trend for casualties per 1,000 incidents is increasing. Compared to the state value the number of casualties per 1,000 fire incidents is lower.Casualties per 1,000 incidents in Reno, NV compared to nearest cities:
(Note: Based on data for all years, including only cities with at least 500 fire incidents)
| Reno: | 6.9 |
| Sparks: | 11.4 |
| Virginia City: | 0.0 |
| Dayton: | 10.4 |
| Carson City: | 14.7 |
| Fernley: | 3.6 |
| Gardnerville: | 0.0 |
 30.5% incidents where reported in the morning and 69.5% in the evening. The most fires (15.4%) took place on Saturday, and the least (13.2%) on Thursday.
 According to the 12,735 fire incident reports from years 2003 - 2018 most fires (13.0%) took place during July, and the least (5.7%) in February.
 Out of all 186,501 cases reported during the years 2003 - 2018, the most belonged to the categories: Rescue & EMS (60.9%), Good Intent Call (17.8%), and Fire (6.8%).
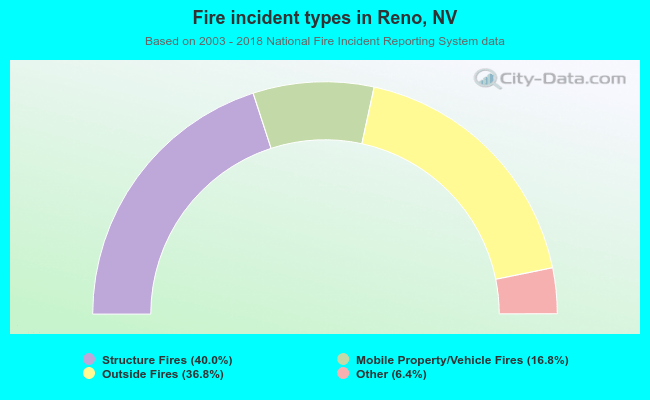 When looking into fire subcategories, the most reports belonged to: Structure Fires (40.0%), and Outside Fires (36.8%).