Wood River: Fire Incidents, Illinois (IL)
Where are fire incidents reported in Wood River, IL
Something went wrong! Please refresh the page.
| Fire incidents reported | |
|---|---|
| Sreet name | Count |
| EDWARDSVILLE RD | 156 |
| WOOD RIVER AVE | 100 |
| LORENA AVE | 76 |
| FERGUSON AVE | 68 |
| PENNING AVE | 64 |
| MAIN ST | 62 |
| ACTON AVE | 46 |
| CENTRAL AVE | 38 |
| WHITELAW AVE | 36 |
| HALLER AVE | 34 |
| MADISON AVE | 34 |
| WESLEY DR | 26 |
| JENNINGS AVE | 24 |
| SIXTH ST | 24 |
| AVALON ST | 22 |
| RICE ST | 22 |
| CHARLES ST | 20 |
| OLD ST. LOUIS RD | 20 |
| THOMPSON AVE | 20 |
| VAUGHN RD | 20 |
| 3RD ST | 18 |
| ECKHARD AVE | 18 |
| FIRST ST | 18 |
| LESLIE AVE | 18 |
| STATE ST | 18 |
| BERRY RD | 16 |
| CARSTENS AVE | 16 |
| FIFTH ST | 16 |
| GEORGE ST | 16 |
| LINTON ST | 16 |
| Other | 22 |
2002 - 2018 National Fire Incident Reporting System (NFIRS) incidents
- Incident types reported to NFIRS in Wood River, IL
- 6,56065.0%Rescue & EMS
- 1,10410.9%Fire
- 7917.8%Hazardous Condition
- 6046.0%Service Call
- 5145.1%False Alarm
- 5005.0%Good Intent Call
- 180.2%Overpressure Rupture
- Fire incident types reported to NFIRS in Wood River, IL
- 57251.8%Structure Fires
- 34431.2%Outside Fires
- 15914.4%Mobile Property/Vehicle Fires
- 292.6%Other
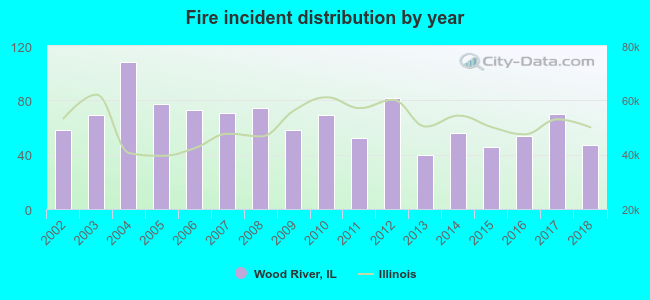 According to the data from the years 2002 - 2018 the average number of fire incidents per year is 65. The highest number of fire incidents - 108 took place in 2004, and the least - 40 in 2013. The data has a dropping trend.
The average number of yearly fire incidents per 10k residents in Wood River, IL compared to nearest cities:
(Note: Based on data for the last 3 years, including only cities with population 5,000 and above)
| Wood River: | 55.0 |
| East Alton: | 107.8 |
| Bethalto: | 16.0 |
| Alton: | 67.8 |
| Edwardsville: | 34.3 |
| Godfrey: | 39.2 |
| Pontoon Beach: | 67.6 |
| Glen Carbon: | 17.8 |
| Granite City: | 49.8 |
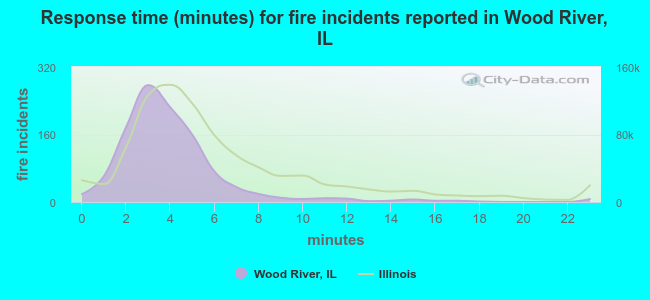 The median response time based on all reported fire incidents is 4 minutes. This is lower compared to the Illinois median value.
The median response time in Wood River, IL compared to nearest cities:
(Note: Based on data for all years, including only cities with at least 500 fire incidents)
| Wood River: | 4 minutes |
| East Alton: | 4 minutes |
| Alton: | 3 minutes |
| Edwardsville: | 7 minutes |
| Godfrey: | 5 minutes |
| Pontoon Beach: | 7 minutes |
| Granite City: | 3 minutes |
| Brighton: | 8 minutes |
| Madison: | 6 minutes |
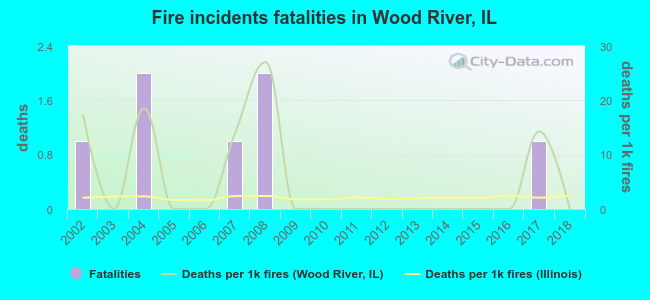 Based on the reports from the years 2002 - 2018 the average number of fire-related yearly deaths is 0. The highest number of deaths - 2 took place in 2004, and the lowest - 0 in 2003. The data has a declining trend.
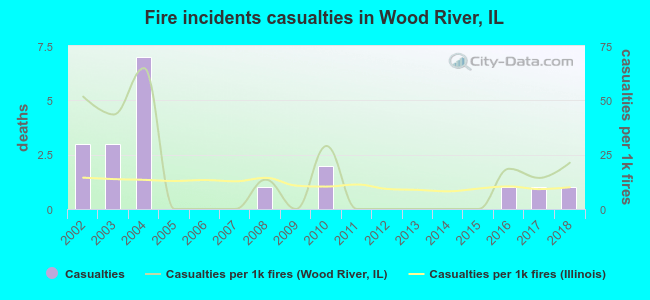 Based on the reports from the years 2002 - 2018 the average number of fire-related casualties per year is 1. The highest number of reported casualties - 7 took place in 2004, and the lowest - 0 in 2005. The data has a decreasing trend.
The average number of injuries per 1,000 fire incidents is 15. This indicator was the highest - 65 in 2004, and the lowest 0 in 2005. The trend for casualties per 1,000 incidents is decreasing. Compared to the Illinois value the number of injuries per 1,000 incidents is higher.
Based on the reports from the years 2002 - 2018 the average number of fire-related casualties per year is 1. The highest number of reported casualties - 7 took place in 2004, and the lowest - 0 in 2005. The data has a decreasing trend.
The average number of injuries per 1,000 fire incidents is 15. This indicator was the highest - 65 in 2004, and the lowest 0 in 2005. The trend for casualties per 1,000 incidents is decreasing. Compared to the Illinois value the number of injuries per 1,000 incidents is higher.Casualties per 1,000 incidents in Wood River, IL compared to nearest cities:
(Note: Based on data for all years, including only cities with at least 500 fire incidents)
| Wood River: | 17.2 |
| East Alton: | 22.3 |
| Alton: | 13.1 |
| Edwardsville: | 6.5 |
| Godfrey: | 9.4 |
| Pontoon Beach: | 2.2 |
| Granite City: | 19.8 |
| Brighton: | 13.5 |
| Madison: | 2.0 |
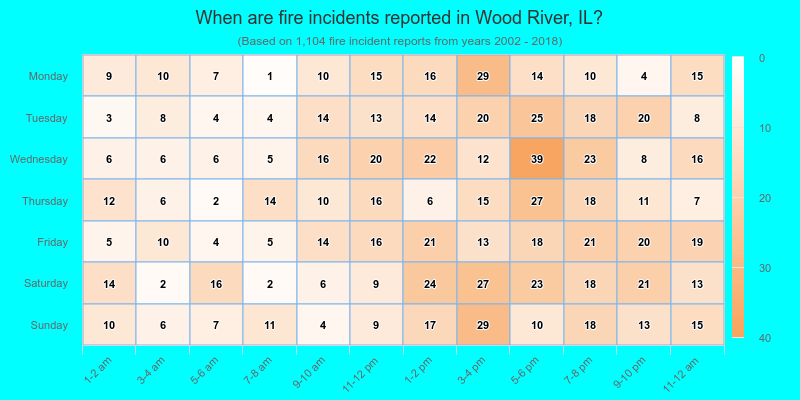
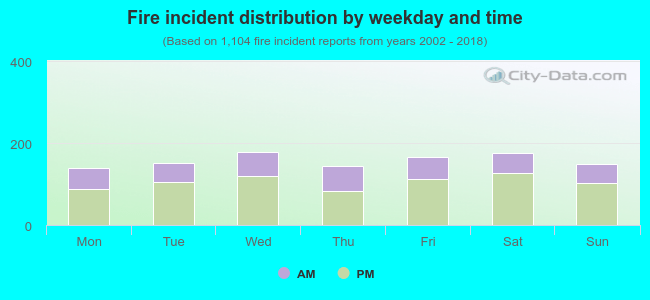 33.2% incidents where reported in the morning and 66.8% in the evening. The most fires (16.2%) took place on Wednesday, and the least (12.7%) on Monday.
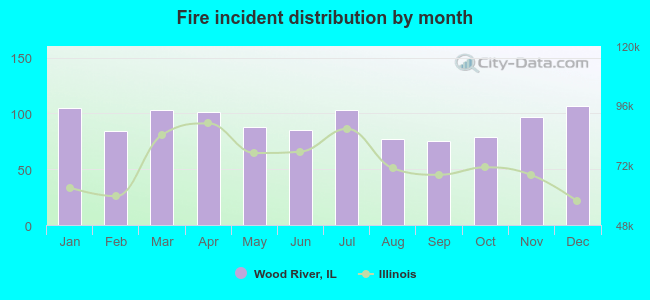 Based on the 1,104 incident reports from years 2002 - 2018 most fires (9.7%) took place during December, and the least (6.8%) in September.
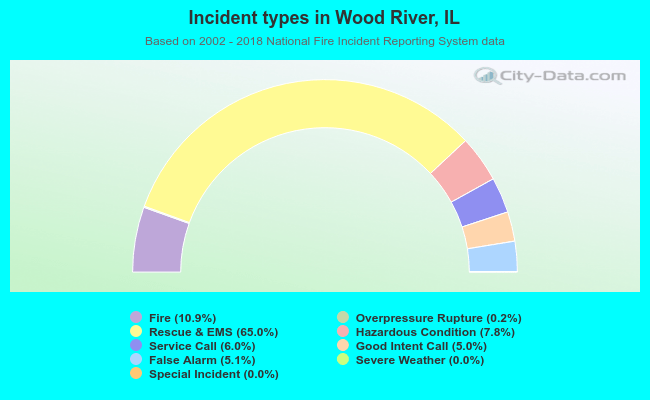 Out of all 10,094 cases reported during the years 2002 - 2018, the most belonged to the categories: Rescue & EMS (65.0%), Fire (10.9%), and Hazardous Condition (7.8%).
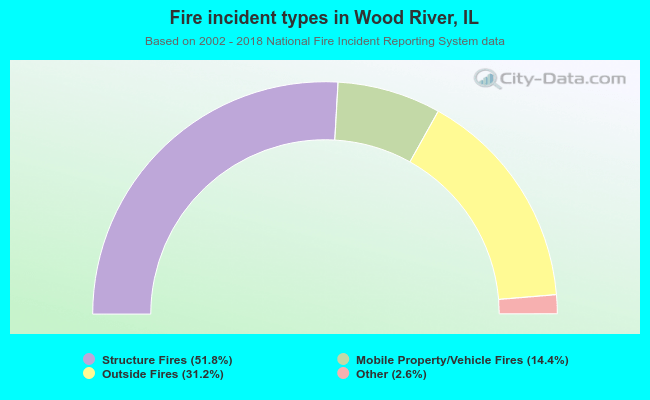 When looking into fire subcategories, the most incidents belonged to: Structure Fires (51.8%), and Outside Fires (31.2%).