Glen Carbon: Fire Incidents, Illinois (IL)
Where are fire incidents reported in Glen Carbon, IL
Something went wrong! Please refresh the page.
|
| |||||||||||||||||||||||||||||||||||||||||||||||||||||||||||||||||||||||||||||||||||||||||||||||||||||||||||||
2002 - 2018 National Fire Incident Reporting System (NFIRS) incidents
- Incident types reported to NFIRS in Glen Carbon, IL
- 5,93276.0%Rescue & EMS
- 5667.2%Hazardous Condition
- 4275.5%Fire
- 4155.3%False Alarm
- 3624.6%Good Intent Call
- 951.2%Service Call
- 100.1%Severe Weather
- Fire incident types reported to NFIRS in Glen Carbon, IL
- 18142.4%Structure Fires
- 12629.5%Outside Fires
- 8820.6%Mobile Property/Vehicle Fires
- 327.5%Other
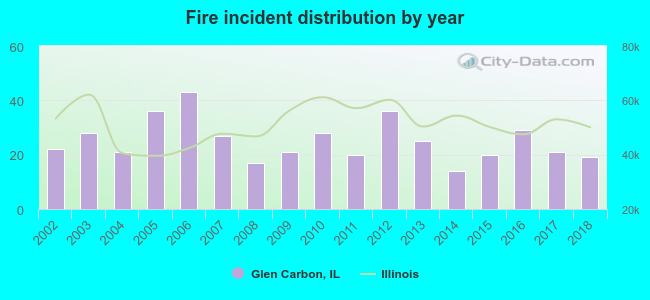 According to the data from the years 2002 - 2018 the average number of fires per year is 25. The highest number of fire incidents - 43 took place in 2006, and the least - 14 in 2014. The data has a decreasing trend.
The average number of yearly fire incidents per 10k residents in Glen Carbon, IL compared to nearest cities:
(Note: Based on data for the last 3 years, including only cities with population 5,000 and above)
| Glen Carbon: | 17.8 |
| Maryville: | 3.8 |
| Edwardsville: | 34.3 |
| Troy: | 44.4 |
| Pontoon Beach: | 67.6 |
| Collinsville: | 53.9 |
| Granite City: | 49.8 |
| Wood River: | 55.0 |
| Bethalto: | 16.0 |
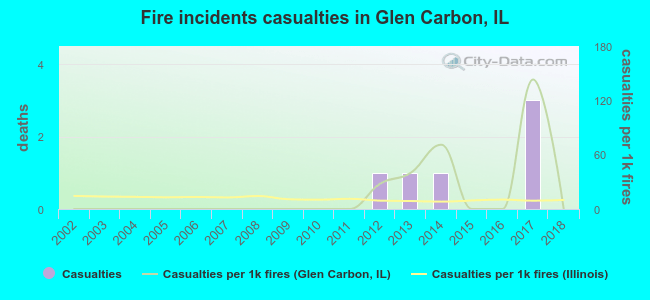 According to the reports from the years 2002 - 2018 the average number of fire-related yearly casualties is 0. The highest number of reported casualties - 3 took place in 2017, and the lowest - 0 in 2002. The data has a constant trend.
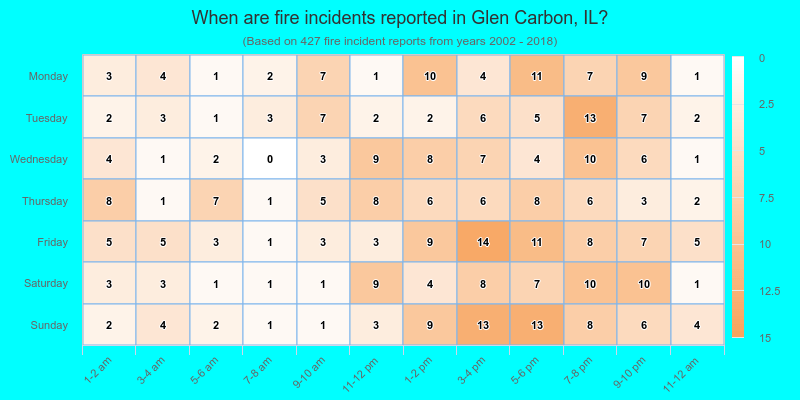
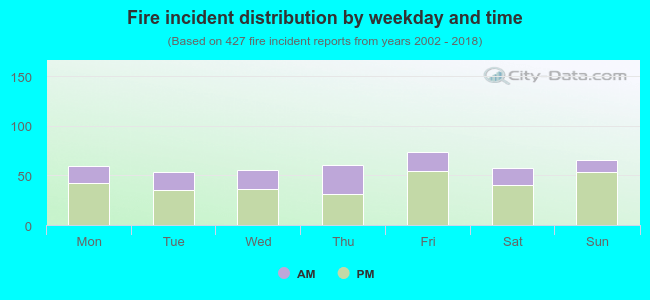 31.9% incidents where reported in the morning and 68.1% in the evening. The most fires (17.3%) took place on Friday, and the least (12.4%) on Tuesday.
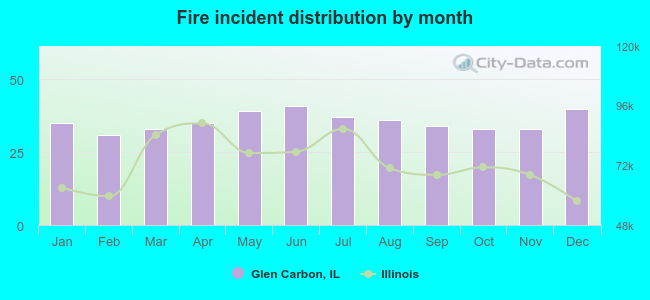 According to the 427 incident reports from years 2002 - 2018 most fires (9.6%) took place during June, and the least (7.3%) in February.
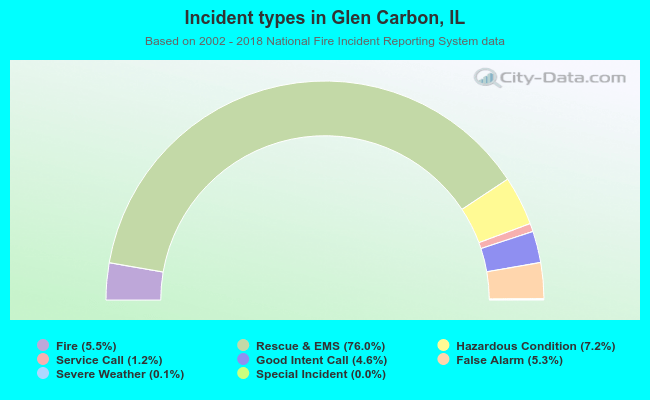 Out of all 7,810 cases reported during the years 2002 - 2018, the most belonged to the categories: Overpressure Rupture (76.0%), Rescue & EMS (7.2%), and Fire (5.5%).
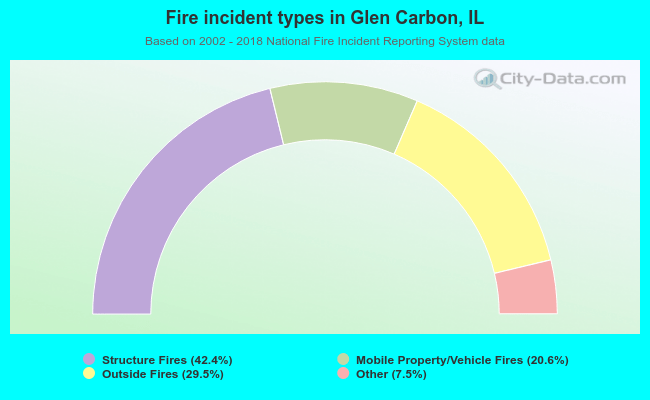 When looking into fire subcategories, the most reports belonged to: Structure Fires (42.4%), and Outside Fires (29.5%).