Edwardsville: Fire Incidents, Illinois (IL)
Where are fire incidents reported in Edwardsville, IL
Something went wrong! Please refresh the page.
| Fire incidents reported | |
|---|---|
| Sreet name | Count |
| BRYANT AVE | 70 |
| TROY RD | 58 |
| SAND RD | 44 |
| MAIN ST | 36 |
| OLD ALTON EDWARDSVILLE RD | 30 |
| OLD CARPENTER RD | 30 |
| ST RT 159 | 30 |
| CENTER GROVE RD | 28 |
| GATEWAY COMMERCE CENTER DR | 28 |
| ST RT 140 | 26 |
| WANDA RD | 26 |
| BUCHANAN ST | 24 |
| PIN OAK RD | 24 |
| ST JAMES DR | 24 |
| UNIVERSITY DR | 24 |
| COUGAR LAKE DR | 22 |
| QUERCUS GROVE RD | 22 |
| ST JAMES | 22 |
| STATE RT 157 HWY | 22 |
| WESTWAY DR | 22 |
| EDWARDSVILLE RD | 20 |
| EDWARDSVILLE CROSSING DR | 16 |
| CIRCLE DR | 14 |
| ENTERPRISE DR | 14 |
| ESIC DR | 14 |
| HILLSBORO AVE | 14 |
| NEW POAG RD | 14 |
| OLD CARPENTER RD | 14 |
| SCHWARZ ST | 14 |
| UNION ST | 14 |
| Other | 472 |
2002 - 2018 National Fire Incident Reporting System (NFIRS) incidents
- Incident types reported to NFIRS in Edwardsville, IL
- 10,51763.8%Rescue & EMS
- 1,74810.6%Service Call
- 1,2327.5%Fire
- 1,2117.3%Hazardous Condition
- 1,0296.2%False Alarm
- 6694.1%Good Intent Call
- 520.3%Severe Weather
- 170.1%Overpressure Rupture
- Fire incident types reported to NFIRS in Edwardsville, IL
- 55044.6%Structure Fires
- 43335.1%Outside Fires
- 20716.8%Mobile Property/Vehicle Fires
- 423.4%Other
 According to the data from the years 2002 - 2018 the average number of fire incidents per year is 72. The highest number of fires - 113 took place in 2012, and the least - 21 in 2006. The data has a rising trend.
The average number of yearly fire incidents per 10k residents in Edwardsville, IL compared to nearest cities:
(Note: Based on data for the last 3 years, including only cities with population 5,000 and above)
| Edwardsville: | 34.3 |
| Glen Carbon: | 17.8 |
| Maryville: | 3.8 |
| Troy: | 44.4 |
| Pontoon Beach: | 67.6 |
| Wood River: | 55.0 |
| Bethalto: | 16.0 |
| Collinsville: | 53.9 |
| East Alton: | 107.8 |
 The median response time based on all reported fire incidents is 7 minutes. This is higher compared to the Illinois median value.
The median response time in Edwardsville, IL compared to nearest cities:
(Note: Based on data for all years, including only cities with at least 500 fire incidents)
| Edwardsville: | 7 minutes |
| Troy: | 8 minutes |
| Pontoon Beach: | 7 minutes |
| Wood River: | 4 minutes |
| Collinsville: | 5 minutes |
| East Alton: | 4 minutes |
| Granite City: | 3 minutes |
| Caseyville: | 6 minutes |
| Alton: | 3 minutes |
 According to the data from the years 2002 - 2018 the average number of fire-related yearly deaths is 0. The highest number of reported deaths - 2 took place in 2012, and the lowest - 0 in 2002. The data has a constant trend.
 Based on the reports from the years 2002 - 2018 the average number of fire-related casualties per year is 0. The highest number of casualties - 3 took place in 2013, and the lowest - 0 in 2002. The data has a constant trend.
The average number of casualties per 1,000 fires is 5. This indicator was the highest - 28 in 2013, and the lowest 0 in 2002. The trend for injuries per 1,000 incidents is constant. Compared to the Illinois value the number of casualties per 1,000 fire incidents is lower.
Based on the reports from the years 2002 - 2018 the average number of fire-related casualties per year is 0. The highest number of casualties - 3 took place in 2013, and the lowest - 0 in 2002. The data has a constant trend.
The average number of casualties per 1,000 fires is 5. This indicator was the highest - 28 in 2013, and the lowest 0 in 2002. The trend for injuries per 1,000 incidents is constant. Compared to the Illinois value the number of casualties per 1,000 fire incidents is lower.Casualties per 1,000 incidents in Edwardsville, IL compared to nearest cities:
(Note: Based on data for all years, including only cities with at least 500 fire incidents)
| Edwardsville: | 6.5 |
| Troy: | 3.5 |
| Pontoon Beach: | 2.2 |
| Wood River: | 17.2 |
| Collinsville: | 16.9 |
| East Alton: | 22.3 |
| Granite City: | 19.8 |
| Caseyville: | 1.5 |
| Alton: | 13.1 |
 30.4% incidents where reported in the morning and 69.6% in the evening. The most fires (15.9%) took place on Friday, and the least (12.0%) on Tuesday.
 Based on the 1,232 reports from years 2002 - 2018 most fires (12.7%) took place during March, and the least (6.3%) in May.
 Out of all 16,484 cases reported during the years 2002 - 2018, the most belonged to the categories: Rescue & EMS (63.8%), Service Call (10.6%), and Fire (7.5%).
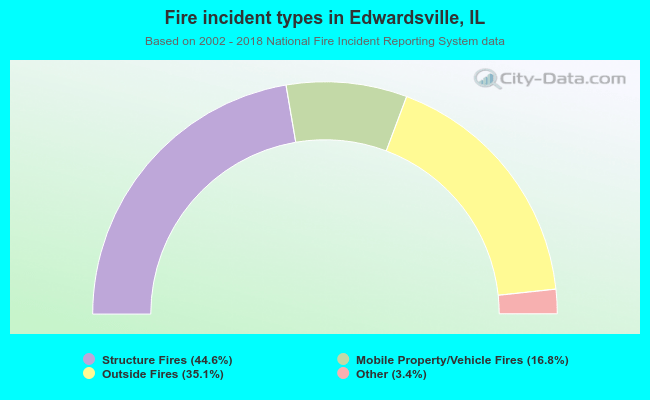 When looking into fire subcategories, the most reports belonged to: Structure Fires (44.6%), and Outside Fires (35.1%).