Sherwood Manor, CT (Connecticut) Houses and Residents
| Sherwood Manor: | $246,912 |
| Connecticut: | $347,200 |
Mean price in 2022:
Detached houses: $244,354
Here: $244,354 State: $503,946 Townhouses or other attached units: $215,720
Here: $215,720 State: $304,959 In 3-to-4-unit structures: $209,070
Here: $209,070 State: $272,970 In 5-or-more-unit structures: $3,099,606
Here: $3,099,606 State: $249,308
Total population: 5,410 (All urban)
Houses: 2,259 (2,220 occupied: 1,807 owner occupied, 438 renter occupied)
| % of renters here: | 20% |
| State: | 34% |
Housing density: 722 houses/condos per square mile
Median price asked for vacant for-sale houses and condos in 2022: $543,338.
Median contract rent in 2022: $1,311 (lower quartile is $1,094, upper quartile is $1,521)
Median rent asked for vacant for-rent units in 2022: $989
Median gross rent in Sherwood Manor, CT in 2022: $1,645
Housing units in Sherwood Manor with a mortgage: 1,110 (127 second mortgage, 0 home equity loan, 93 both second mortgage and home equity loan)
Houses without a mortgage: 0
Median household income for houses/condos with a mortgage: $105,646
Median household income for apartments without a mortgage: $96,826
Median monthly housing costs: $1,537
Compare current foreclosures near Sherwood Manor, CT:
| Photo | Address | Area | Beds / Baths | Price | Details |
|---|---|---|---|---|---|

|
#1
Kozley Rd
Tolland, CT 06084
|
1,132 sq. feet
|
2 baths 3 beds |
$264,900
|
show details |

|
#2
Jondot Dr
Enfield, CT 06082
|
1,385 sq. feet
|
1 baths 3 beds |
$299,900
|
show details |

|
#3
Reservoir Rd
Vernon Rockville, CT 06066
|
1,288 sq. feet
|
2 baths 3 beds |
$379,900
|
show details |

|
#4
Mountain Rd
Windsor, CT 06095
|
1,144 sq. feet
|
2 baths 3 beds |
$230,000
|
show details |

|
#5
Newberry Rd
South Windsor, CT 06074
|
3,386 sq. feet
|
2 baths 4 beds |
$644,900
|
show details |

|
#6
Irving St
Manchester, CT 06042
|
1,335 sq. feet
|
2 baths 3 beds |
$251,750
|
show details |

|
#7
Shares Ln
South Windsor, CT 06074
|
1,850 sq. feet
|
2 baths 4 beds |
$365,000
|
show details |

|
#8
Walnut Street
Springfield, MA 01105
|
2,850 sq. feet
|
2 baths 6 beds |
$99,900
|
show details |

|
#9
Newman St
Springfield, MA 01105
|
1,676 sq. feet
|
2 baths 3 beds |
$45,900
|
show details |

|
#10
Linwood Dr
Bloomfield, CT 06002
|
1,190 sq. feet
|
2 baths 3 beds |
show details |
| Photo | Address | Area | Beds / Baths | Price | Details |
|---|---|---|---|---|---|

|
#11
Russell Rd Apt C13
Westfield, MA 01085
|
962 sq. feet
|
2 baths 2 beds |
show details | |

|
#12
Hickory Ln
Hampden, MA 01036
|
2,227 sq. feet
|
3 baths 4 beds |
show details | |

|
#13
Banfield Ln
Bloomfield, CT 06002
|
984 sq. feet
|
1 baths 4 beds |
show details | |

|
#14
Washington Rd
Enfield, CT 06082
|
1,100 sq. feet
|
2 baths 3 beds |
show details | |

|
#15
S West St
Feeding Hills, MA 01030
|
1,341 sq. feet
|
1 baths 2 beds |
show details | |

|
#16
Sandra Dr
Bloomfield, CT 06002
|
992 sq. feet
|
3 baths 3 beds |
show details | |

|
#17
Kenyon St
Springfield, MA 01109
|
2,602 sq. feet
|
2 baths 7 beds |
show details | |

|
#18
S Water St Unit 21
East Windsor, CT 06088
|
1,311 sq. feet
|
2 baths 2 beds |
show details | |

|
#19
Burnham St
Manchester, CT 06042
|
1,630 sq. feet
|
2 baths 4 beds |
show details | |

|
#20
Banfield Ln
Bloomfield, CT 06002
|
1,100 sq. feet
|
2 baths 3 beds |
show details |
| Photo | Address | Area | Beds / Baths | Price | Details |
|---|---|---|---|---|---|

|
#21
Faneuil St
Windsor, CT 06095
|
1,578 sq. feet
|
3 baths 3 beds |
show details | |

|
#22
Highland Ave
Monson, MA 01057
|
1,204 sq. feet
|
2 baths 3 beds |
show details | |

|
#23
Ellsworth Dr
Bloomfield, CT 06002
|
984 sq. feet
|
1 baths 3 beds |
show details | |

|
#24
Dwight St
Holyoke, MA 01040
|
3,194 sq. feet
|
2 baths 4 beds |
show details | |

|
#25
Deerfield Rd
Windsor, CT 06095
|
1,534 sq. feet
|
3 baths 3 beds |
show details | |

|
#26
College St
Chicopee, MA 01020
|
1,902 sq. feet
|
2 baths 3 beds |
show details | |

|
#27
Matianuck Ave
Windsor, CT 06095
|
1,410 sq. feet
|
2 baths 3 beds |
show details | |

|
#28
Royal St
Chicopee, MA 01020
|
3,296 sq. feet
|
4 baths 7 beds |
show details | |

|
#29
Campbell Ave
Vernon Rockville, CT 06066
|
1,344 sq. feet
|
1 baths 4 beds |
show details | |

|
#30
Pembroke St
Springfield, MA 01104
|
864 sq. feet
|
1 baths 3 beds |
show details |
| Photo | Address | Area | Beds / Baths | Price | Details |
|---|---|---|---|---|---|

|
#31
Montford St
Springfield, MA 01109
|
2,200 sq. feet
|
2 baths 6 beds |
show details | |

|
#32
Hope Cir
Windsor, CT 06095
|
1,827 sq. feet
|
3 baths 4 beds |
show details | |

|
#33
Arrowbrook Rd
Windsor, CT 06095
|
1,421 sq. feet
|
2 baths 3 beds |
show details | |

|
#34
Lancashire Rd
Springfield, MA 01104
|
1,702 sq. feet
|
3 baths 3 beds |
show details | |

|
#35
Vadnais St
Springfield, MA 01104
|
950 sq. feet
|
1 baths 3 beds |
show details | |

|
#36
Stafford Rd
Monson, MA 01057
|
1,464 sq. feet
|
1 baths 3 beds |
show details | |

|
#37
Woodland Dr
Hampden, MA 01036
|
972 sq. feet
|
1 baths 3 beds |
show details | |

|
#38
Cambridge Ct
Simsbury, CT 06070
|
2,155 sq. feet
|
4 baths 4 beds |
show details | |

|
#39
Hampden Cir
Simsbury, CT 06070
|
2,314 sq. feet
|
3 baths 4 beds |
show details | |

|
#40
Beatrice Ave
Bloomfield, CT 06002
|
2,218 sq. feet
|
4 baths 6 beds |
show details |
| Photo | Address | Area | Beds / Baths | Price | Details |
|---|---|---|---|---|---|

|
#41
Skinner Rd
Broad Brook, CT 06016
|
2,297 sq. feet
|
3 baths 3 beds |
show details | |

|
#42
Woodford Dr
Bloomfield, CT 06002
|
1,000 sq. feet
|
2 baths 2 beds |
show details | |

|
#43
Strickland St
Manchester, CT 06042
|
2,496 sq. feet
|
2 baths 5 beds |
show details | |

|
#44
Derryfield Ave
Springfield, MA 01118
|
1,188 sq. feet
|
1 baths 3 beds |
show details | |

|
#45
Ellington Rd
East Hartford, CT 06108
|
1,721 sq. feet
|
2 baths 2 beds |
show details | |

|
#46
Main St
East Hartford, CT 06108
|
1,411 sq. feet
|
2 baths 4 beds |
show details | |

|
#47
E Morningside St
Hartford, CT 06112
|
768 sq. feet
|
1 baths 2 beds |
show details | |

|
#48
Chestnut St
Windsor Locks, CT 06096
|
1,462 sq. feet
|
2 baths 3 beds |
show details | |

|
#49
Cliffside Dr Unit G
Manchester, CT 06042
|
1,669 sq. feet
|
3 baths 3 beds |
show details | |

|
Check over 1 million property listings on Foreclosure.com!
|
browse all offers | |||


Median year apartment built: 1981
Household type by relationship:
Households: 5,754- Male householders: 971 (253 living alone), Female householders: 1,245 (429 living alone)
1,113 spouses (1,071 opposite-sex spouses), 228 unmarried partners, (226 opposite-sex unmarried partners), 1,696 children (1,563 natural, 6 adopted, 127 stepchildren), 108 grandchildren, 5 brothers or sisters, 23 parents, 0 foster children, 36 other relatives, 312 non-relatives
- In group quarters: 13
Size of family households: 714 2-persons, 221 3-persons, 212 4-persons, 175 5-persons, 45 6-persons, 38 7-or-more-persons.
Size of nonfamily households: 720 1-person, 113 2-persons, 6 4-persons.
799 married couples with children.
222 single-parent households (26 men, 196 women).
87.8% of residents of Sherwood Manor speak English at home.
3.9% of residents speak Spanish at home (93% speak English very well, 7% speak English well).
7.0% of residents speak other Indo-European language at home (64% speak English very well, 18% speak English well, 15% speak English not well, 2% don't speak English at all).
0.3% of residents speak Asian or Pacific Island language at home (100% speak English very well).
0.5% of residents speak other language at home (100% speak English very well).
Foreign born population: 383 (6.7%)
(88.3% of them are naturalized citizens)
| Here: | 6.1 |
| State: | 6.5 |
| Here: | 4.1 |
| State: | 4.0 |

- Bedrooms in owner-occupied houses and condos in Sherwood Manor, Connecticut
- 0no bedroom
- 171 bedroom
- 3042 bedrooms
- 9813 bedrooms
- 4794 bedrooms
- 255+ bedrooms

- Bedrooms in renter-occupied apartments in Sherwood Manor, Connecticut
- 0no bedroom
- 2011 bedroom
- 1192 bedrooms
- 953 bedrooms
- 234 bedrooms
- 05+ bedrooms

- Cars and other vehicles available in Sherwood Manor in owner-occupied houses/condos
- 38no vehicle
- 5121 vehicle
- 8952 vehicles
- 2273 vehicles
- 1024 vehicles
- 355+ vehicles

- Cars and other vehicles available in Sherwood Manor in renter-occupied apartments
- 0no vehicle
- 2561 vehicle
- 1362 vehicles
- 463 vehicles
- 04 vehicles
- 05+ vehicles

- Rooms in owner-occupied houses in Sherwood Manor, Connecticut
- 01 room
- 122 rooms
- 03 rooms
- 1974 rooms
- 3945 rooms
- 4666 rooms
- 4147 rooms
- 2258 rooms
- 1009+ rooms

- Rooms in renter-occupied apartments in Sherwood Manor, Connecticut
- 01 room
- 282 rooms
- 1053 rooms
- 1224 rooms
- 1005 rooms
- 466 rooms
- 147 rooms
- 238 rooms
- 09+ rooms


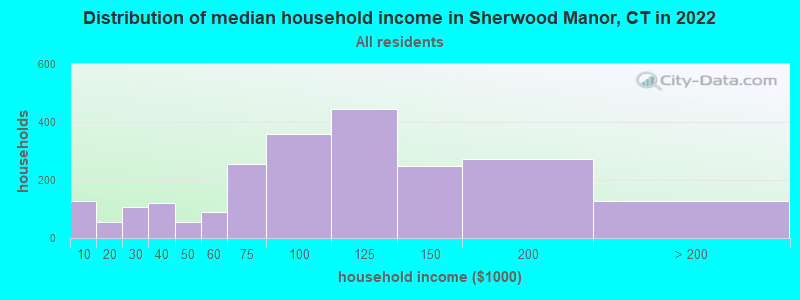
Sherwood Manor, CT household income distribution

- 126Less than $10,000
- 55$10,000 to $19,999
- 106$20,000 to $29,999
- 119$30,000 to $39,999
- 54$40,000 to $49,999
- 90$50,000 to $59,999
- 255$60,000 to $74,999
- 360$75,000 to $99,999
- 445$100,000 to $124,999
- 247$125,000 to $149,999
- 274$150,000 to $199,999
- 126$200,000 or more
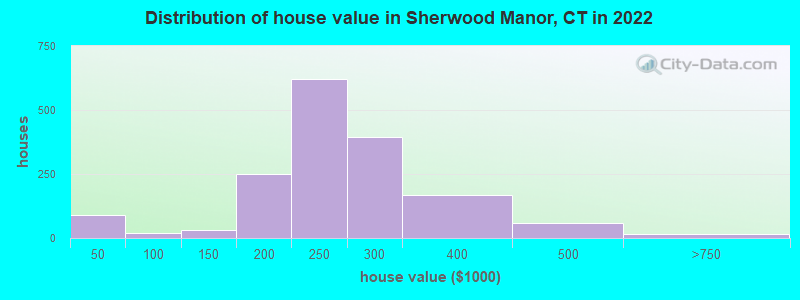
Home value of owner - occupied houses in 2022 in Sherwood Manor, CT
-
- 28Less than $10,000
- 28$10,000 to $14,999
- 20$15,000 to $19,999
- 10$25,000 to $29,999
- 17$90,000 to $99,999
- 4$100,000 to $124,999
- 27$125,000 to $149,999
- 126$150,000 to $174,999
- 123$175,000 to $199,999
- 620$200,000 to $249,999
- 394$250,000 to $299,999
- 167$300,000 to $399,999
- 58$400,000 to $499,999
- 5$500,000 to $749,999
- 10$750,000 to $999,999
Rent paid by renters in 2022 in Sherwood Manor, CT
-
- 32$800 to $899
- 15$900 to $999
- 120$1,000 to $1,249
- 128$1,250 to $1,499
- 106$1,500 to $1,999
- 32No cash rent


Percentage of workers working in this county: 80.8%
Number of people working at home: 403 (12.6% of all workers)
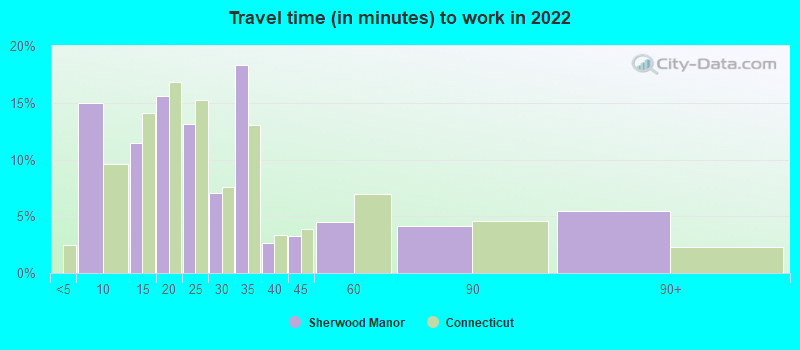
Travel time to work (commute)
- Less than 5 minutes: 11
- 5 to 9 minutes: 255
- 10 to 14 minutes: 354
- 15 to 19 minutes: 334
- 20 to 24 minutes: 476
- 25 to 29 minutes: 284
- 30 to 34 minutes: 693
- 35 to 39 minutes: 72
- 40 to 44 minutes: 125
- 45 to 59 minutes: 55
- 60 to 89 minutes: 57
- 90 or more minutes: 50

Means of transportation to work:
- Drove a car alone: 2,032 (70.0%)
- Carpooled: 349 (12.0%)
- Bus: 23 (0.8%)
- Taxi: 21 (0.7%)
- Walked: 57 (2.0%)
- Worked at home: 403 (13.9%)

- Unemployment by race in 2022
- Unemployment rate for White non-Hispanic residents
- 6.1%Males
- 0.5%Females
- Unemployment rate for Asian residents
- 8.8%Males
- 8.4%Females
- Unemployment rate for Hispanic or Latino residents
- 4.6%Males
- 3.5%Females

- Year of entry for the foreign-born population in Sherwood Manor, Connecticut
- 492010 or later
- 902000 to 2009
- 1171990 to 1999
- 441980 to 1989
- 311970 to 1979
- 151Before 1970

First ancestries reported:
- French: 239 (10.3%)
- Irish: 204 (8.8%)
- Polish: 186 (8.0%)
- Italian: 179 (7.7%)
- English: 152 (6.5%)
- Haitian: 111 (4.8%)
- American: 74 (3.2%)
- Guyanese: 73 (3.1%)
- French Canadian: 68 (2.9%)
- European: 55 (2.4%)
- German: 54 (2.3%)
- Ukrainian: 36 (1.5%)
- Canadian: 31 (1.3%)
- Danish: 24 (1.0%)
- Greek: 21 (0.9%)
- Norwegian: 19 (0.8%)
- Portuguese: 17 (0.7%)
- Swedish: 16 (0.7%)
- Albanian: 12 (0.5%)
- Austrian: 12 (0.5%)
- British: 12 (0.5%)
- Pennsylvania German: 11 (0.5%)
- Turkish: 9 (0.4%)
- Eastern European: 8 (0.3%)
- Lithuanian: 7 (0.3%)
- Scottish: 7 (0.3%)
- Russian: 6 (0.3%)
- Scotch-Irish: 6 (0.3%)
- Swiss: 6 (0.3%)
Most common places of birth for foreign-born residents (%):
| Sherwood Manor: | 22.7% (87) |
| Connecticut: | 1.3% (7,003) |
| Sherwood Manor: | 9.4% (36) |
| Connecticut: | 5.0% (27,361) |
| Sherwood Manor: | 9.4% (36) |
| Connecticut: | 2.4% (12,881) |
| Sherwood Manor: | 6.8% (26) |
| Connecticut: | 2.3% (12,380) |
| Sherwood Manor: | 6.5% (25) |
| Connecticut: | 1.0% (5,447) |
| Sherwood Manor: | 6.5% (25) |
| Connecticut: | 4.0% (21,729) |
| Sherwood Manor: | 5.7% (22) |
| Connecticut: | 0.3% (1,550) |
| Sherwood Manor: | 3.7% (14) |
| Connecticut: | 2.5% (13,591) |
| Sherwood Manor: | 3.4% (13) |
| Connecticut: | 1.7% (9,214) |
| Sherwood Manor: | 3.1% (12) |
| Connecticut: | 1.9% (10,545) |
| Sherwood Manor: | 2.9% (11) |
| Connecticut: | 0.9% (5,088) |
| Sherwood Manor: | 2.9% (11) |
| Connecticut: | 4.4% (24,026) |
| Sherwood Manor: | 2.6% (10) |
| Connecticut: | 0.9% (5,157) |
| Sherwood Manor: | 2.1% (8) |
| Connecticut: | 1.2% (6,678) |
| Sherwood Manor: | 1.8% (7) |
| Connecticut: | 1.3% (7,149) |
| Sherwood Manor: | 1.6% (6) |
| Connecticut: | 0.3% (1,475) |
Place of birth for U.S.-born residents:
- This state: 3,213
- Other state: 1,981
- Northeast: 1,777
- Midwest: 44
- South: 90
- West: 88
88.6% of Sherwood Manor residents lived in the same house 1 years ago.
Out of people who lived in different houses, 31.7% lived in this county.
Out of people who lived in different counties, 5.4% lived in Connecticut.
| Sherwood Manor: | 88.6% |
| State average: | 88.4% |
Education attainment for males 25 years and older:
- No schooling: 49
- Nursery to 4th grade: 7
- 5th and 6th grade: 0
- 7th and 8th grade: 0
- 9th grade: 7
- 10th grade: 0
- 11th grade: 0
- 12th grade, no diploma: 9
- High school graduate (or equivalency): 826
- Less than 1 year of college: 118
- Some college more than 1 year, no degree: 213
- Associate degree: 196
- Bachelor's degree: 300
- Master's degree: 93
- Professional school degree: 33
- Doctorate degree: 10

Education attainment for females 25 years and older:
- No schooling: 1
- Nursery to 4th grade: 0
- 5th and 6th grade: 0
- 7th and 8th grade: 0
- 9th grade: 5
- 10th grade: 13
- 11th grade: 8
- 12th grade, no diploma: 32
- High school graduate (or equivalency): 612
- Less than 1 year of college: 275
- Some college more than 1 year, no degree: 232
- Associate degree: 334
- Bachelor's degree: 271
- Master's degree: 192
- Professional school degree: 14
- Doctorate degree: 11


Housing units in structures:
- One, detached: 1,598
- One, attached: 189
- Two: 14
- 3 or 4: 111
- 5 to 9: 56
- 10 to 19: 149
- 20 to 49: 38
- 50 or more: 79
- Mobile homes: 22
House/condo owner moved in on average 17 years ago
Renter moved in on average 1 years ago

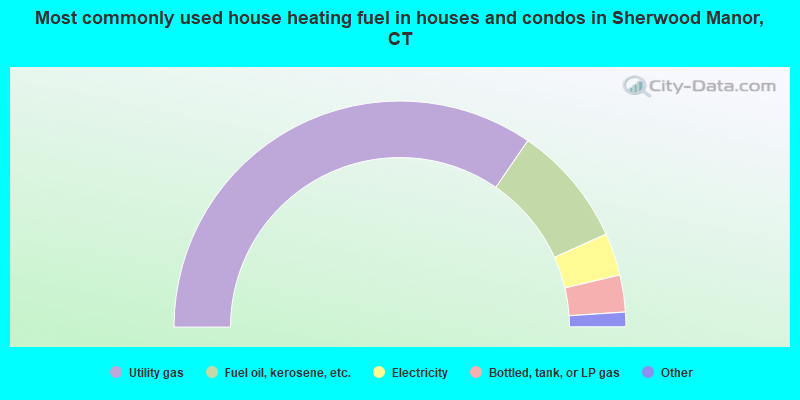
- 69.3%Utility gas
- 17.4%Fuel oil, kerosene, etc.
- 6.1%Electricity
- 5.3%Bottled, tank, or LP gas
- 1.1%Wood
- 0.8%Other fuel
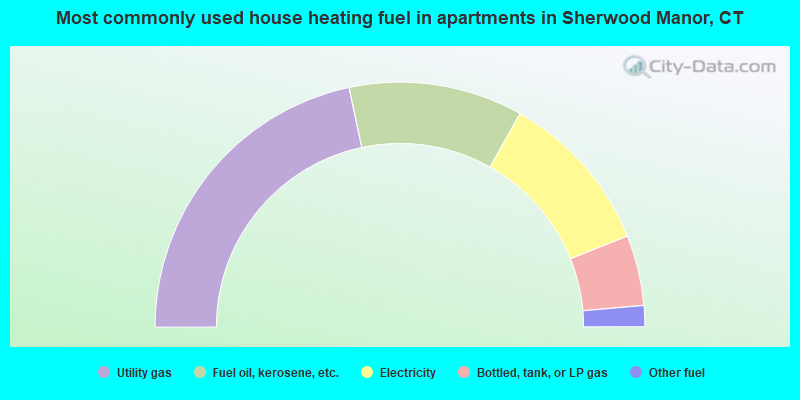
- 43.4%Utility gas
- 23.0%Fuel oil, kerosene, etc.
- 21.6%Electricity
- 9.3%Bottled, tank, or LP gas
- 2.8%Other fuel
Private vs. public school enrollment:
| Here: | 6.8% |
| Connecticut: | 9.5% |
| Here: | 0.0% |
| Connecticut: | 12.9% |
| Here: | 14.5% |
| Connecticut: | 35.5% |


