Washingtonville, New York Submit your own pictures of this village and show them to the world
OSM Map
General Map
Google Map
MSN Map
OSM Map
General Map
Google Map
MSN Map
OSM Map
General Map
Google Map
MSN Map
OSM Map
General Map
Google Map
MSN Map
Please wait while loading the map...
Population in 2022: 5,695 (100% urban, 0% rural). Population change since 2000: -2.7%Males: 2,952 Females: 2,743
March 2022 cost of living index in Washingtonville: 133.9 (high, U.S. average is 100) Percentage of residents living in poverty in 2022: 7.4%for White Non-Hispanic residents , 6.6% for Black residents , 6.2% for Hispanic or Latino residents , 9.9% for two or more races residents )
Profiles of local businesses
Business Search - 14 Million verified businesses
Data:
Median household income ($)
Median household income (% change since 2000)
Household income diversity
Ratio of average income to average house value (%)
Ratio of average income to average rent
Median household income ($) - White
Median household income ($) - Black or African American
Median household income ($) - Asian
Median household income ($) - Hispanic or Latino
Median household income ($) - American Indian and Alaska Native
Median household income ($) - Multirace
Median household income ($) - Other Race
Median household income for houses/condos with a mortgage ($)
Median household income for apartments without a mortgage ($)
Races - White alone (%)
Races - White alone (% change since 2000)
Races - Black alone (%)
Races - Black alone (% change since 2000)
Races - American Indian alone (%)
Races - American Indian alone (% change since 2000)
Races - Asian alone (%)
Races - Asian alone (% change since 2000)
Races - Hispanic (%)
Races - Hispanic (% change since 2000)
Races - Native Hawaiian and Other Pacific Islander alone (%)
Races - Native Hawaiian and Other Pacific Islander alone (% change since 2000)
Races - Two or more races (%)
Races - Two or more races (% change since 2000)
Races - Other race alone (%)
Races - Other race alone (% change since 2000)
Racial diversity
Unemployment (%)
Unemployment (% change since 2000)
Unemployment (%) - White
Unemployment (%) - Black or African American
Unemployment (%) - Asian
Unemployment (%) - Hispanic or Latino
Unemployment (%) - American Indian and Alaska Native
Unemployment (%) - Multirace
Unemployment (%) - Other Race
Population density (people per square mile)
Population - Males (%)
Population - Females (%)
Population - Males (%) - White
Population - Males (%) - Black or African American
Population - Males (%) - Asian
Population - Males (%) - Hispanic or Latino
Population - Males (%) - American Indian and Alaska Native
Population - Males (%) - Multirace
Population - Males (%) - Other Race
Population - Females (%) - White
Population - Females (%) - Black or African American
Population - Females (%) - Asian
Population - Females (%) - Hispanic or Latino
Population - Females (%) - American Indian and Alaska Native
Population - Females (%) - Multirace
Population - Females (%) - Other Race
Coronavirus confirmed cases (May 21, 2024)
Deaths caused by coronavirus (May 21, 2024)
Coronavirus confirmed cases (per 100k population) (May 21, 2024)
Deaths caused by coronavirus (per 100k population) (May 21, 2024)
Daily increase in number of cases (May 21, 2024)
Weekly increase in number of cases (May 21, 2024)
Cases doubled (in days) (May 21, 2024)
Hospitalized patients (Apr 18, 2022)
Negative test results (Apr 18, 2022)
Total test results (Apr 18, 2022)
COVID Vaccine doses distributed (per 100k population) (Sep 19, 2023)
COVID Vaccine doses administered (per 100k population) (Sep 19, 2023)
COVID Vaccine doses distributed (Sep 19, 2023)
COVID Vaccine doses administered (Sep 19, 2023)
Likely homosexual households (%)
Likely homosexual households (% change since 2000)
Likely homosexual households - Lesbian couples (%)
Likely homosexual households - Lesbian couples (% change since 2000)
Likely homosexual households - Gay men (%)
Likely homosexual households - Gay men (% change since 2000)
Cost of living index
Median gross rent ($)
Median contract rent ($)
Median monthly housing costs ($)
Median house or condo value ($)
Median house or condo value ($ change since 2000)
Mean house or condo value by units in structure - 1, detached ($)
Mean house or condo value by units in structure - 1, attached ($)
Mean house or condo value by units in structure - 2 ($)
Mean house or condo value by units in structure by units in structure - 3 or 4 ($)
Mean house or condo value by units in structure - 5 or more ($)
Mean house or condo value by units in structure - Boat, RV, van, etc. ($)
Mean house or condo value by units in structure - Mobile home ($)
Median house or condo value ($) - White
Median house or condo value ($) - Black or African American
Median house or condo value ($) - Asian
Median house or condo value ($) - Hispanic or Latino
Median house or condo value ($) - American Indian and Alaska Native
Median house or condo value ($) - Multirace
Median house or condo value ($) - Other Race
Median resident age
Resident age diversity
Median resident age - Males
Median resident age - Females
Median resident age - White
Median resident age - Black or African American
Median resident age - Asian
Median resident age - Hispanic or Latino
Median resident age - American Indian and Alaska Native
Median resident age - Multirace
Median resident age - Other Race
Median resident age - Males - White
Median resident age - Males - Black or African American
Median resident age - Males - Asian
Median resident age - Males - Hispanic or Latino
Median resident age - Males - American Indian and Alaska Native
Median resident age - Males - Multirace
Median resident age - Males - Other Race
Median resident age - Females - White
Median resident age - Females - Black or African American
Median resident age - Females - Asian
Median resident age - Females - Hispanic or Latino
Median resident age - Females - American Indian and Alaska Native
Median resident age - Females - Multirace
Median resident age - Females - Other Race
Commute - mean travel time to work (minutes)
Travel time to work - Less than 5 minutes (%)
Travel time to work - Less than 5 minutes (% change since 2000)
Travel time to work - 5 to 9 minutes (%)
Travel time to work - 5 to 9 minutes (% change since 2000)
Travel time to work - 10 to 19 minutes (%)
Travel time to work - 10 to 19 minutes (% change since 2000)
Travel time to work - 20 to 29 minutes (%)
Travel time to work - 20 to 29 minutes (% change since 2000)
Travel time to work - 30 to 39 minutes (%)
Travel time to work - 30 to 39 minutes (% change since 2000)
Travel time to work - 40 to 59 minutes (%)
Travel time to work - 40 to 59 minutes (% change since 2000)
Travel time to work - 60 to 89 minutes (%)
Travel time to work - 60 to 89 minutes (% change since 2000)
Travel time to work - 90 or more minutes (%)
Travel time to work - 90 or more minutes (% change since 2000)
Marital status - Never married (%)
Marital status - Now married (%)
Marital status - Separated (%)
Marital status - Widowed (%)
Marital status - Divorced (%)
Median family income ($)
Median family income (% change since 2000)
Median non-family income ($)
Median non-family income (% change since 2000)
Median per capita income ($)
Median per capita income (% change since 2000)
Median family income ($) - White
Median family income ($) - Black or African American
Median family income ($) - Asian
Median family income ($) - Hispanic or Latino
Median family income ($) - American Indian and Alaska Native
Median family income ($) - Multirace
Median family income ($) - Other Race
Median year house/condo built
Median year apartment built
Year house built - Built 2005 or later (%)
Year house built - Built 2000 to 2004 (%)
Year house built - Built 1990 to 1999 (%)
Year house built - Built 1980 to 1989 (%)
Year house built - Built 1970 to 1979 (%)
Year house built - Built 1960 to 1969 (%)
Year house built - Built 1950 to 1959 (%)
Year house built - Built 1940 to 1949 (%)
Year house built - Built 1939 or earlier (%)
Average household size
Household density (households per square mile)
Average household size - White
Average household size - Black or African American
Average household size - Asian
Average household size - Hispanic or Latino
Average household size - American Indian and Alaska Native
Average household size - Multirace
Average household size - Other Race
Occupied housing units (%)
Vacant housing units (%)
Owner occupied housing units (%)
Renter occupied housing units (%)
Vacancy status - For rent (%)
Vacancy status - For sale only (%)
Vacancy status - Rented or sold, not occupied (%)
Vacancy status - For seasonal, recreational, or occasional use (%)
Vacancy status - For migrant workers (%)
Vacancy status - Other vacant (%)
Residents with income below the poverty level (%)
Residents with income below 50% of the poverty level (%)
Children below poverty level (%)
Poor families by family type - Married-couple family (%)
Poor families by family type - Male, no wife present (%)
Poor families by family type - Female, no husband present (%)
Poverty status for native-born residents (%)
Poverty status for foreign-born residents (%)
Poverty among high school graduates not in families (%)
Poverty among people who did not graduate high school not in families (%)
Residents with income below the poverty level (%) - White
Residents with income below the poverty level (%) - Black or African American
Residents with income below the poverty level (%) - Asian
Residents with income below the poverty level (%) - Hispanic or Latino
Residents with income below the poverty level (%) - American Indian and Alaska Native
Residents with income below the poverty level (%) - Multirace
Residents with income below the poverty level (%) - Other Race
Air pollution - Air Quality Index (AQI)
Air pollution - CO
Air pollution - NO2
Air pollution - SO2
Air pollution - Ozone
Air pollution - PM10
Air pollution - PM25
Air pollution - Pb
Crime - Murders per 100,000 population
Crime - Rapes per 100,000 population
Crime - Robberies per 100,000 population
Crime - Assaults per 100,000 population
Crime - Burglaries per 100,000 population
Crime - Thefts per 100,000 population
Crime - Auto thefts per 100,000 population
Crime - Arson per 100,000 population
Crime - City-data.com crime index
Crime - Violent crime index
Crime - Property crime index
Crime - Murders per 100,000 population (5 year average)
Crime - Rapes per 100,000 population (5 year average)
Crime - Robberies per 100,000 population (5 year average)
Crime - Assaults per 100,000 population (5 year average)
Crime - Burglaries per 100,000 population (5 year average)
Crime - Thefts per 100,000 population (5 year average)
Crime - Auto thefts per 100,000 population (5 year average)
Crime - Arson per 100,000 population (5 year average)
Crime - City-data.com crime index (5 year average)
Crime - Violent crime index (5 year average)
Crime - Property crime index (5 year average)
1996 Presidential Elections Results (%) - Democratic Party (Clinton)
1996 Presidential Elections Results (%) - Republican Party (Dole)
1996 Presidential Elections Results (%) - Other
2000 Presidential Elections Results (%) - Democratic Party (Gore)
2000 Presidential Elections Results (%) - Republican Party (Bush)
2000 Presidential Elections Results (%) - Other
2004 Presidential Elections Results (%) - Democratic Party (Kerry)
2004 Presidential Elections Results (%) - Republican Party (Bush)
2004 Presidential Elections Results (%) - Other
2008 Presidential Elections Results (%) - Democratic Party (Obama)
2008 Presidential Elections Results (%) - Republican Party (McCain)
2008 Presidential Elections Results (%) - Other
2012 Presidential Elections Results (%) - Democratic Party (Obama)
2012 Presidential Elections Results (%) - Republican Party (Romney)
2012 Presidential Elections Results (%) - Other
2016 Presidential Elections Results (%) - Democratic Party (Clinton)
2016 Presidential Elections Results (%) - Republican Party (Trump)
2016 Presidential Elections Results (%) - Other
2020 Presidential Elections Results (%) - Democratic Party (Biden)
2020 Presidential Elections Results (%) - Republican Party (Trump)
2020 Presidential Elections Results (%) - Other
Ancestries Reported - Arab (%)
Ancestries Reported - Czech (%)
Ancestries Reported - Danish (%)
Ancestries Reported - Dutch (%)
Ancestries Reported - English (%)
Ancestries Reported - French (%)
Ancestries Reported - French Canadian (%)
Ancestries Reported - German (%)
Ancestries Reported - Greek (%)
Ancestries Reported - Hungarian (%)
Ancestries Reported - Irish (%)
Ancestries Reported - Italian (%)
Ancestries Reported - Lithuanian (%)
Ancestries Reported - Norwegian (%)
Ancestries Reported - Polish (%)
Ancestries Reported - Portuguese (%)
Ancestries Reported - Russian (%)
Ancestries Reported - Scotch-Irish (%)
Ancestries Reported - Scottish (%)
Ancestries Reported - Slovak (%)
Ancestries Reported - Subsaharan African (%)
Ancestries Reported - Swedish (%)
Ancestries Reported - Swiss (%)
Ancestries Reported - Ukrainian (%)
Ancestries Reported - United States (%)
Ancestries Reported - Welsh (%)
Ancestries Reported - West Indian (%)
Ancestries Reported - Other (%)
Educational Attainment - No schooling completed (%)
Educational Attainment - Less than high school (%)
Educational Attainment - High school or equivalent (%)
Educational Attainment - Less than 1 year of college (%)
Educational Attainment - 1 or more years of college (%)
Educational Attainment - Associate degree (%)
Educational Attainment - Bachelor's degree (%)
Educational Attainment - Master's degree (%)
Educational Attainment - Professional school degree (%)
Educational Attainment - Doctorate degree (%)
School Enrollment - Nursery, preschool (%)
School Enrollment - Kindergarten (%)
School Enrollment - Grade 1 to 4 (%)
School Enrollment - Grade 5 to 8 (%)
School Enrollment - Grade 9 to 12 (%)
School Enrollment - College undergrad (%)
School Enrollment - Graduate or professional (%)
School Enrollment - Not enrolled in school (%)
School enrollment - Public schools (%)
School enrollment - Private schools (%)
School enrollment - Not enrolled (%)
Median number of rooms in houses and condos
Median number of rooms in apartments
Housing units lacking complete plumbing facilities (%)
Housing units lacking complete kitchen facilities (%)
Density of houses
Urban houses (%)
Rural houses (%)
Households with people 60 years and over (%)
Households with people 65 years and over (%)
Households with people 75 years and over (%)
Households with one or more nonrelatives (%)
Households with no nonrelatives (%)
Population in households (%)
Family households (%)
Nonfamily households (%)
Population in families (%)
Family households with own children (%)
Median number of bedrooms in owner occupied houses
Mean number of bedrooms in owner occupied houses
Median number of bedrooms in renter occupied houses
Mean number of bedrooms in renter occupied houses
Median number of vehichles in owner occupied houses
Mean number of vehichles in owner occupied houses
Median number of vehichles in renter occupied houses
Mean number of vehichles in renter occupied houses
Mortgage status - with mortgage (%)
Mortgage status - with second mortgage (%)
Mortgage status - with home equity loan (%)
Mortgage status - with both second mortgage and home equity loan (%)
Mortgage status - without a mortgage (%)
Average family size
Average family size - White
Average family size - Black or African American
Average family size - Asian
Average family size - Hispanic or Latino
Average family size - American Indian and Alaska Native
Average family size - Multirace
Average family size - Other Race
Geographical mobility - Same house 1 year ago (%)
Geographical mobility - Moved within same county (%)
Geographical mobility - Moved from different county within same state (%)
Geographical mobility - Moved from different state (%)
Geographical mobility - Moved from abroad (%)
Place of birth - Born in state of residence (%)
Place of birth - Born in other state (%)
Place of birth - Native, outside of US (%)
Place of birth - Foreign born (%)
Housing units in structures - 1, detached (%)
Housing units in structures - 1, attached (%)
Housing units in structures - 2 (%)
Housing units in structures - 3 or 4 (%)
Housing units in structures - 5 to 9 (%)
Housing units in structures - 10 to 19 (%)
Housing units in structures - 20 to 49 (%)
Housing units in structures - 50 or more (%)
Housing units in structures - Mobile home (%)
Housing units in structures - Boat, RV, van, etc. (%)
House/condo owner moved in on average (years ago)
Renter moved in on average (years ago)
Year householder moved into unit - Moved in 1999 to March 2000 (%)
Year householder moved into unit - Moved in 1995 to 1998 (%)
Year householder moved into unit - Moved in 1990 to 1994 (%)
Year householder moved into unit - Moved in 1980 to 1989 (%)
Year householder moved into unit - Moved in 1970 to 1979 (%)
Year householder moved into unit - Moved in 1969 or earlier (%)
Means of transportation to work - Drove car alone (%)
Means of transportation to work - Carpooled (%)
Means of transportation to work - Public transportation (%)
Means of transportation to work - Bus or trolley bus (%)
Means of transportation to work - Streetcar or trolley car (%)
Means of transportation to work - Subway or elevated (%)
Means of transportation to work - Railroad (%)
Means of transportation to work - Ferryboat (%)
Means of transportation to work - Taxicab (%)
Means of transportation to work - Motorcycle (%)
Means of transportation to work - Bicycle (%)
Means of transportation to work - Walked (%)
Means of transportation to work - Other means (%)
Working at home (%)
Industry diversity
Most Common Industries - Agriculture, forestry, fishing and hunting, and mining (%)
Most Common Industries - Agriculture, forestry, fishing and hunting (%)
Most Common Industries - Mining, quarrying, and oil and gas extraction (%)
Most Common Industries - Construction (%)
Most Common Industries - Manufacturing (%)
Most Common Industries - Wholesale trade (%)
Most Common Industries - Retail trade (%)
Most Common Industries - Transportation and warehousing, and utilities (%)
Most Common Industries - Transportation and warehousing (%)
Most Common Industries - Utilities (%)
Most Common Industries - Information (%)
Most Common Industries - Finance and insurance, and real estate and rental and leasing (%)
Most Common Industries - Finance and insurance (%)
Most Common Industries - Real estate and rental and leasing (%)
Most Common Industries - Professional, scientific, and management, and administrative and waste management services (%)
Most Common Industries - Professional, scientific, and technical services (%)
Most Common Industries - Management of companies and enterprises (%)
Most Common Industries - Administrative and support and waste management services (%)
Most Common Industries - Educational services, and health care and social assistance (%)
Most Common Industries - Educational services (%)
Most Common Industries - Health care and social assistance (%)
Most Common Industries - Arts, entertainment, and recreation, and accommodation and food services (%)
Most Common Industries - Arts, entertainment, and recreation (%)
Most Common Industries - Accommodation and food services (%)
Most Common Industries - Other services, except public administration (%)
Most Common Industries - Public administration (%)
Occupation diversity
Most Common Occupations - Management, business, science, and arts occupations (%)
Most Common Occupations - Management, business, and financial occupations (%)
Most Common Occupations - Management occupations (%)
Most Common Occupations - Business and financial operations occupations (%)
Most Common Occupations - Computer, engineering, and science occupations (%)
Most Common Occupations - Computer and mathematical occupations (%)
Most Common Occupations - Architecture and engineering occupations (%)
Most Common Occupations - Life, physical, and social science occupations (%)
Most Common Occupations - Education, legal, community service, arts, and media occupations (%)
Most Common Occupations - Community and social service occupations (%)
Most Common Occupations - Legal occupations (%)
Most Common Occupations - Education, training, and library occupations (%)
Most Common Occupations - Arts, design, entertainment, sports, and media occupations (%)
Most Common Occupations - Healthcare practitioners and technical occupations (%)
Most Common Occupations - Health diagnosing and treating practitioners and other technical occupations (%)
Most Common Occupations - Health technologists and technicians (%)
Most Common Occupations - Service occupations (%)
Most Common Occupations - Healthcare support occupations (%)
Most Common Occupations - Protective service occupations (%)
Most Common Occupations - Fire fighting and prevention, and other protective service workers including supervisors (%)
Most Common Occupations - Law enforcement workers including supervisors (%)
Most Common Occupations - Food preparation and serving related occupations (%)
Most Common Occupations - Building and grounds cleaning and maintenance occupations (%)
Most Common Occupations - Personal care and service occupations (%)
Most Common Occupations - Sales and office occupations (%)
Most Common Occupations - Sales and related occupations (%)
Most Common Occupations - Office and administrative support occupations (%)
Most Common Occupations - Natural resources, construction, and maintenance occupations (%)
Most Common Occupations - Farming, fishing, and forestry occupations (%)
Most Common Occupations - Construction and extraction occupations (%)
Most Common Occupations - Installation, maintenance, and repair occupations (%)
Most Common Occupations - Production, transportation, and material moving occupations (%)
Most Common Occupations - Production occupations (%)
Most Common Occupations - Transportation occupations (%)
Most Common Occupations - Material moving occupations (%)
People in Group quarters - Institutionalized population (%)
People in Group quarters - Correctional institutions (%)
People in Group quarters - Federal prisons and detention centers (%)
People in Group quarters - Halfway houses (%)
People in Group quarters - Local jails and other confinement facilities (including police lockups) (%)
People in Group quarters - Military disciplinary barracks (%)
People in Group quarters - State prisons (%)
People in Group quarters - Other types of correctional institutions (%)
People in Group quarters - Nursing homes (%)
People in Group quarters - Hospitals/wards, hospices, and schools for the handicapped (%)
People in Group quarters - Hospitals/wards and hospices for chronically ill (%)
People in Group quarters - Hospices or homes for chronically ill (%)
People in Group quarters - Military hospitals or wards for chronically ill (%)
People in Group quarters - Other hospitals or wards for chronically ill (%)
People in Group quarters - Hospitals or wards for drug/alcohol abuse (%)
People in Group quarters - Mental (Psychiatric) hospitals or wards (%)
People in Group quarters - Schools, hospitals, or wards for the mentally retarded (%)
People in Group quarters - Schools, hospitals, or wards for the physically handicapped (%)
People in Group quarters - Institutions for the deaf (%)
People in Group quarters - Institutions for the blind (%)
People in Group quarters - Orthopedic wards and institutions for the physically handicapped (%)
People in Group quarters - Wards in general hospitals for patients who have no usual home elsewhere (%)
People in Group quarters - Wards in military hospitals for patients who have no usual home elsewhere (%)
People in Group quarters - Juvenile institutions (%)
People in Group quarters - Long-term care (%)
People in Group quarters - Homes for abused, dependent, and neglected children (%)
People in Group quarters - Residential treatment centers for emotionally disturbed children (%)
People in Group quarters - Training schools for juvenile delinquents (%)
People in Group quarters - Short-term care, detention or diagnostic centers for delinquent children (%)
People in Group quarters - Type of juvenile institution unknown (%)
People in Group quarters - Noninstitutionalized population (%)
People in Group quarters - College dormitories (includes college quarters off campus) (%)
People in Group quarters - Military quarters (%)
People in Group quarters - On base (%)
People in Group quarters - Barracks, unaccompanied personnel housing (UPH), (Enlisted/Officer), ;and similar group living quarters for military personnel (%)
People in Group quarters - Transient quarters for temporary residents (%)
People in Group quarters - Military ships (%)
People in Group quarters - Group homes (%)
People in Group quarters - Homes or halfway houses for drug/alcohol abuse (%)
People in Group quarters - Homes for the mentally ill (%)
People in Group quarters - Homes for the mentally retarded (%)
People in Group quarters - Homes for the physically handicapped (%)
People in Group quarters - Other group homes (%)
People in Group quarters - Religious group quarters (%)
People in Group quarters - Dormitories (%)
People in Group quarters - Agriculture workers' dormitories on farms (%)
People in Group quarters - Job Corps and vocational training facilities (%)
People in Group quarters - Other workers' dormitories (%)
People in Group quarters - Crews of maritime vessels (%)
People in Group quarters - Other nonhousehold living situations (%)
People in Group quarters - Other noninstitutional group quarters (%)
Residents speaking English at home (%)
Residents speaking English at home - Born in the United States (%)
Residents speaking English at home - Native, born elsewhere (%)
Residents speaking English at home - Foreign born (%)
Residents speaking Spanish at home (%)
Residents speaking Spanish at home - Born in the United States (%)
Residents speaking Spanish at home - Native, born elsewhere (%)
Residents speaking Spanish at home - Foreign born (%)
Residents speaking other language at home (%)
Residents speaking other language at home - Born in the United States (%)
Residents speaking other language at home - Native, born elsewhere (%)
Residents speaking other language at home - Foreign born (%)
Class of Workers - Employee of private company (%)
Class of Workers - Self-employed in own incorporated business (%)
Class of Workers - Private not-for-profit wage and salary workers (%)
Class of Workers - Local government workers (%)
Class of Workers - State government workers (%)
Class of Workers - Federal government workers (%)
Class of Workers - Self-employed workers in own not incorporated business and Unpaid family workers (%)
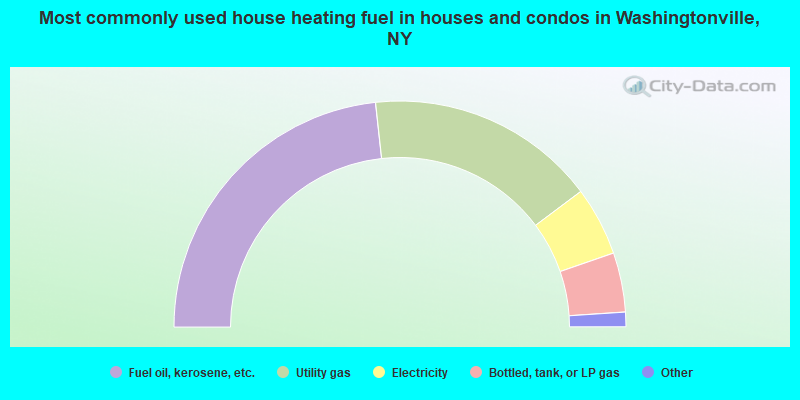
House heating fuel used in houses and condos - Utility gas (%)
House heating fuel used in houses and condos - Bottled, tank, or LP gas (%)
House heating fuel used in houses and condos - Electricity (%)
House heating fuel used in houses and condos - Fuel oil, kerosene, etc. (%)
House heating fuel used in houses and condos - Coal or coke (%)
House heating fuel used in houses and condos - Wood (%)
House heating fuel used in houses and condos - Solar energy (%)
House heating fuel used in houses and condos - Other fuel (%)
House heating fuel used in houses and condos - No fuel used (%)
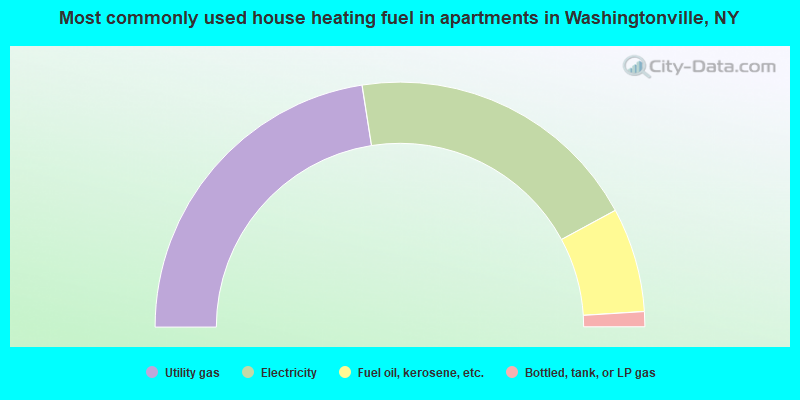
House heating fuel used in apartments - Utility gas (%)
House heating fuel used in apartments - Bottled, tank, or LP gas (%)
House heating fuel used in apartments - Electricity (%)
House heating fuel used in apartments - Fuel oil, kerosene, etc. (%)
House heating fuel used in apartments - Coal or coke (%)
House heating fuel used in apartments - Wood (%)
House heating fuel used in apartments - Solar energy (%)
House heating fuel used in apartments - Other fuel (%)
House heating fuel used in apartments - No fuel used (%)
Armed forces status - In Armed Forces (%)
Armed forces status - Civilian (%)
Armed forces status - Civilian - Veteran (%)
Armed forces status - Civilian - Nonveteran (%)
Fatal accidents locations in years 2005-2021
Fatal accidents locations in 2005
Fatal accidents locations in 2006
Fatal accidents locations in 2007
Fatal accidents locations in 2008
Fatal accidents locations in 2009
Fatal accidents locations in 2010
Fatal accidents locations in 2011
Fatal accidents locations in 2012
Fatal accidents locations in 2013
Fatal accidents locations in 2014
Fatal accidents locations in 2015
Fatal accidents locations in 2016
Fatal accidents locations in 2017
Fatal accidents locations in 2018
Fatal accidents locations in 2019
Fatal accidents locations in 2020
Fatal accidents locations in 2021
Alcohol use - People drinking some alcohol every month (%)
Alcohol use - People not drinking at all (%)
Alcohol use - Average days/month drinking alcohol
Alcohol use - Average drinks/week
Alcohol use - Average days/year people drink much
Audiometry - Average condition of hearing (%)
Audiometry - People that can hear a whisper from across a quiet room (%)
Audiometry - People that can hear normal voice from across a quiet room (%)
Audiometry - Ears ringing, roaring, buzzing (%)
Audiometry - Had a job exposure to loud noise (%)
Audiometry - Had off-work exposure to loud noise (%)
Blood Pressure & Cholesterol - Has high blood pressure (%)
Blood Pressure & Cholesterol - Checking blood pressure at home (%)
Blood Pressure & Cholesterol - Frequently checking blood cholesterol (%)
Blood Pressure & Cholesterol - Has high cholesterol level (%)
Consumer Behavior - Money monthly spent on food at supermarket/grocery store
Consumer Behavior - Money monthly spent on food at other stores
Consumer Behavior - Money monthly spent on eating out
Consumer Behavior - Money monthly spent on carryout/delivered foods
Consumer Behavior - Income spent on food at supermarket/grocery store (%)
Consumer Behavior - Income spent on food at other stores (%)
Consumer Behavior - Income spent on eating out (%)
Consumer Behavior - Income spent on carryout/delivered foods (%)
Current Health Status - General health condition (%)
Current Health Status - Blood donors (%)
Current Health Status - Has blood ever tested for HIV virus (%)
Current Health Status - Left-handed people (%)
Dermatology - People using sunscreen (%)
Diabetes - Diabetics (%)
Diabetes - Had a blood test for high blood sugar (%)
Diabetes - People taking insulin (%)
Diet Behavior & Nutrition - Diet health (%)
Diet Behavior & Nutrition - Milk product consumption (# of products/month)
Diet Behavior & Nutrition - Meals not home prepared (#/week)
Diet Behavior & Nutrition - Meals from fast food or pizza place (#/week)
Diet Behavior & Nutrition - Ready-to-eat foods (#/month)
Diet Behavior & Nutrition - Frozen meals/pizza (#/month)
Drug Use - People that ever used marijuana or hashish (%)
Drug Use - Ever used hard drugs (%)
Drug Use - Ever used any form of cocaine (%)
Drug Use - Ever used heroin (%)
Drug Use - Ever used methamphetamine (%)
Health Insurance - People covered by health insurance (%)
Kidney Conditions-Urology - Avg. # of times urinating at night
Medical Conditions - People with asthma (%)
Medical Conditions - People with anemia (%)
Medical Conditions - People with psoriasis (%)
Medical Conditions - People with overweight (%)
Medical Conditions - Elderly people having difficulties in thinking or remembering (%)
Medical Conditions - People who ever received blood transfusion (%)
Medical Conditions - People having trouble seeing even with glass/contacts (%)
Medical Conditions - People with arthritis (%)
Medical Conditions - People with gout (%)
Medical Conditions - People with congestive heart failure (%)
Medical Conditions - People with coronary heart disease (%)
Medical Conditions - People with angina pectoris (%)
Medical Conditions - People who ever had heart attack (%)
Medical Conditions - People who ever had stroke (%)
Medical Conditions - People with emphysema (%)
Medical Conditions - People with thyroid problem (%)
Medical Conditions - People with chronic bronchitis (%)
Medical Conditions - People with any liver condition (%)
Medical Conditions - People who ever had cancer or malignancy (%)
Mental Health - People who have little interest in doing things (%)
Mental Health - People feeling down, depressed, or hopeless (%)
Mental Health - People who have trouble sleeping or sleeping too much (%)
Mental Health - People feeling tired or having little energy (%)
Mental Health - People with poor appetite or overeating (%)
Mental Health - People feeling bad about themself (%)
Mental Health - People who have trouble concentrating on things (%)
Mental Health - People moving or speaking slowly or too fast (%)
Mental Health - People having thoughts they would be better off dead (%)
Oral Health - Average years since last visit a dentist
Oral Health - People embarrassed because of mouth (%)
Oral Health - People with gum disease (%)
Oral Health - General health of teeth and gums (%)
Oral Health - Average days a week using dental floss/device
Oral Health - Average days a week using mouthwash for dental problem
Oral Health - Average number of teeth
Pesticide Use - Households using pesticides to control insects (%)
Pesticide Use - Households using pesticides to kill weeds (%)
Physical Activity - People doing vigorous-intensity work activities (%)
Physical Activity - People doing moderate-intensity work activities (%)
Physical Activity - People walking or bicycling (%)
Physical Activity - People doing vigorous-intensity recreational activities (%)
Physical Activity - People doing moderate-intensity recreational activities (%)
Physical Activity - Average hours a day doing sedentary activities
Physical Activity - Average hours a day watching TV or videos
Physical Activity - Average hours a day using computer
Physical Functioning - People having limitations keeping them from working (%)
Physical Functioning - People limited in amount of work they can do (%)
Physical Functioning - People that need special equipment to walk (%)
Physical Functioning - People experiencing confusion/memory problems (%)
Physical Functioning - People requiring special healthcare equipment (%)
Prescription Medications - Average number of prescription medicines taking
Preventive Aspirin Use - Adults 40+ taking low-dose aspirin (%)
Reproductive Health - Vaginal deliveries (%)
Reproductive Health - Cesarean deliveries (%)
Reproductive Health - Deliveries resulted in a live birth (%)
Reproductive Health - Pregnancies resulted in a delivery (%)
Reproductive Health - Women breastfeeding newborns (%)
Reproductive Health - Women that had a hysterectomy (%)
Reproductive Health - Women that had both ovaries removed (%)
Reproductive Health - Women that have ever taken birth control pills (%)
Reproductive Health - Women taking birth control pills (%)
Reproductive Health - Women that have ever used Depo-Provera or injectables (%)
Reproductive Health - Women that have ever used female hormones (%)
Sexual Behavior - People 18+ that ever had sex (vaginal, anal, or oral) (%)
Sexual Behavior - Males 18+ that ever had vaginal sex with a woman (%)
Sexual Behavior - Males 18+ that ever performed oral sex on a woman (%)
Sexual Behavior - Males 18+ that ever had anal sex with a woman (%)
Sexual Behavior - Males 18+ that ever had any sex with a man (%)
Sexual Behavior - Females 18+ that ever had vaginal sex with a man (%)
Sexual Behavior - Females 18+ that ever performed oral sex on a man (%)
Sexual Behavior - Females 18+ that ever had anal sex with a man (%)
Sexual Behavior - Females 18+ that ever had any kind of sex with a woman (%)
Sexual Behavior - Average age people first had sex
Sexual Behavior - Average number of female sex partners in lifetime (males 18+)
Sexual Behavior - Average number of female vaginal sex partners in lifetime (males 18+)
Sexual Behavior - Average age people first performed oral sex on a woman (18+)
Sexual Behavior - Average number of woman performed oral sex on in lifetime (18+)
Sexual Behavior - Average number of male sex partners in lifetime (males 18+)
Sexual Behavior - Average number of male anal sex partners in lifetime (males 18+)
Sexual Behavior - Average age people first performed oral sex on a man (18+)
Sexual Behavior - Average number of male oral sex partners in lifetime (18+)
Sexual Behavior - People using protection when performing oral sex (%)
Sexual Behavior - Average number of times people have vaginal or anal sex a year
Sexual Behavior - People having sex without condom (%)
Sexual Behavior - Average number of male sex partners in lifetime (females 18+)
Sexual Behavior - Average number of male vaginal sex partners in lifetime (females 18+)
Sexual Behavior - Average number of female sex partners in lifetime (females 18+)
Sexual Behavior - Circumcised males 18+ (%)
Sleep Disorders - Average hours sleeping at night
Sleep Disorders - People that has trouble sleeping (%)
Smoking-Cigarette Use - People smoking cigarettes (%)
Taste & Smell - People 40+ having problems with smell (%)
Taste & Smell - People 40+ having problems with taste (%)
Taste & Smell - People 40+ that ever had wisdom teeth removed (%)
Taste & Smell - People 40+ that ever had tonsils teeth removed (%)
Taste & Smell - People 40+ that ever had a loss of consciousness because of a head injury (%)
Taste & Smell - People 40+ that ever had a broken nose or other serious injury to face or skull (%)
Taste & Smell - People 40+ that ever had two or more sinus infections (%)
Weight - Average height (inches)
Weight - Average weight (pounds)
Weight - Average BMI
Weight - People that are obese (%)
Weight - People that ever were obese (%)
Weight - People trying to lose weight (%)
Officers per 1,000 residents here:
2.28New York average:
3.28
Latest news from Washingtonville, NY collected exclusively by city-data.com from local newspapers, TV, and radio stations
Ancestries: Italian (21.2%), Irish (16.1%), American (8.0%), German (2.4%), Polish (2.2%), Eastern European (1.8%).
Current Local Time:
Land area: 2.54 square miles.
Population density: 2,239 people per square mile (low).
528 residents are foreign born (4.5% Latin America , 3.6% Europe , 1.2% Asia ).
This village:
9.1%New York:
22.6%
Median real estate property taxes paid for housing units with mortgages in 2022: $9,526 (2.6%)Median real estate property taxes paid for housing units with no mortgage in 2022: $8,536 (2.4%)
Nearest city with pop. 50,000+: Ramapo, NY
Nearest city with pop. 200,000+: Bronx, NY
Nearest cities:
Latitude: 41.43 N, Longitude: 74.16 W
Daytime population change due to commuting: -967 (-16.7%)Workers who live and work in this village: 631 (22.1%)
Single-family new house construction building permits:
2022: 2 buildings , average cost: $298,7002021: 6 buildings , average cost: $162,1002020: 16 buildings , average cost: $123,8002019: 12 buildings , average cost: $151,3002018: 13 buildings , average cost: $152,6002017: 13 buildings , average cost: $144,9002016: 4 buildings , average cost: $143,4002015: 4 buildings , average cost: $199,9002014: 3 buildings , average cost: $185,0002008: 1 building , cost: $150,0002007: 1 building , cost: $250,0002004: 1 building , cost: $200,0002003: 2 buildings , average cost: $75,0002002: 1 building , cost: $75,0002001: 45 buildings , average cost: $67,1002000: 52 buildings , average cost: $70,9001999: 26 buildings , average cost: $62,4001998: 27 buildings , average cost: $62,4001997: 24 buildings , average cost: $62,400Unemployment in December 2023:
Population change in the 1990s: +958 (+19.6%).
Most common occupations in Washingtonville, NY (%)
Both Males Females
Other office and administrative support workers, including supervisors (5.8%)
Other management occupations, except farmers and farm managers (4.9%)
Sales representatives, services, wholesale and manufacturing (4.7%)
Registered nurses (4.4%)
Law enforcement workers, including supervisors (4.2%)
Electrical equipment mechanics and other installation, maintenance, and repair workers, including supervisors (3.8%)
Retail sales workers, except cashiers (3.8%)
Sales representatives, services, wholesale and manufacturing (6.4%)
Electrical equipment mechanics and other installation, maintenance, and repair workers, including supervisors (6.3%)
Law enforcement workers, including supervisors (6.2%)
Vehicle and mobile equipment mechanics, installers, and repairers (4.9%)
Driver/sales workers and truck drivers (3.6%)
Retail sales workers, except cashiers (3.4%)
Other management occupations, except farmers and farm managers (3.3%)
Registered nurses (9.3%)
Other office and administrative support workers, including supervisors (9.1%)
Other management occupations, except farmers and farm managers (6.8%)
Secretaries and administrative assistants (5.5%)
Information and record clerks, except customer service representatives (5.0%)
Retail sales workers, except cashiers (4.3%)
Preschool, kindergarten, elementary, and middle school teachers (3.3%)
Tornado activity:
Washingtonville-area historical tornado activity is above New York state average. It is 34% smaller than the overall U.S. average.
On 7/14/1988, a category F3 (max. wind speeds 158-206 mph) tornado 17.8 miles away from the Washingtonville village center injured one person and caused between $500,000 and $5,000,000 in damages.
On 7/29/1971, a category F2 (max. wind speeds 113-157 mph) tornado 1.5 miles away from the village center caused between $50,000 and $500,000 in damages.
Earthquake activity:
Washingtonville-area historical earthquake activity is significantly above New York state average. It is 68% smaller than the overall U.S. average. On 10/7/1983 at 10:18:46, a magnitude 5.3 (5.1 MB, 5.3 LG, 5.1 ML, Class: Moderate, Intensity: VI - VII) earthquake occurred 174.7 miles away from Washingtonville center On 4/20/2002 at 10:50:47, a magnitude 5.3 (5.3 ML, Depth: 3.0 mi) earthquake occurred 214.4 miles away from Washingtonville center On 8/23/2011 at 17:51:04, a magnitude 5.8 (5.8 MW, Depth: 3.7 mi) earthquake occurred 315.9 miles away from Washingtonville center On 4/20/2002 at 10:50:47, a magnitude 5.2 (5.2 MB, 4.2 MS, 5.2 MW, 5.0 MW) earthquake occurred 212.5 miles away from Washingtonville center On 1/16/1994 at 01:49:16, a magnitude 4.6 (4.6 MB, 4.6 LG, Depth: 3.1 mi, Class: Light, Intensity: IV - V) earthquake occurred 124.4 miles away from Washingtonville center On 1/19/1982 at 00:14:42, a magnitude 4.7 (4.5 MB, 4.7 MD, 4.5 LG) earthquake occurred 193.6 miles away from the city center Magnitude types: regional Lg-wave magnitude (LG), body-wave magnitude (MB), duration magnitude (MD), local magnitude (ML), surface-wave magnitude (MS), moment magnitude (MW) Natural disasters: The number of natural disasters in Orange County (28) is a lot greater than the US average (15).Major Disasters (Presidential) Declared: 18Emergencies Declared: 9Floods: 8, Storms: 8, Hurricanes: 7, Blizzards: 2, Snowstorms: 2, Tropical Storms: 2, Fire: 1, Power Outage: 1, Tropical Depression: 1, Water Shortage: 1, Other: 3 (Note: some incidents may be assigned to more than one category). Hospitals and medical centers near Washingtonville: WILLCARE HUDSON VALLEY CHHA (Home Health Center, about 7 miles away; NEWBURGH, NY)
HAMASPIK OF ORANGE COUNTY, INC. (Hospital, about 7 miles away; MONROE, NY)
CAMPBELL HALL REHAB CENTER (Nursing Home, about 7 miles away; CAMPBELL HALL, NY)
ST DOMINIC'S HOME (Hospital, about 8 miles away; GOSHEN, NY)
HOSPICE OF ORANGE AND SULLIVAN COUNTIES INC (Hospital, about 8 miles away; NEWBURGH, NY)
LIBERTY HUDSON VALLEY DIALYSIS (Dialysis Facility, about 8 miles away; NEWBURGH, NY)
ELANT AT NEWBURGH INC (Nursing Home, about 8 miles away; NEWBURGH, NY)
Heliports located in Washingtonville: Operable nuclear power plants near Washingtonville:
17 miles: Indian Point 2 and 3 in Buchanan, NY.
Colleges/universities with over 2000 students nearest to Washingtonville:
Mount Saint Mary College (about 10 miles; Newburgh, NY ; Full-time enrollment: 2,166)
United States Military Academy (about 11 miles; West Point, NY ; FT enrollment: 5,651)
Orange County Community College (about 15 miles; Middletown, NY ; FT enrollment: 4,742)
Rockland Community College (about 21 miles; Suffern, NY ; FT enrollment: 6,026)
State University of New York at New Paltz (about 22 miles; New Paltz, NY ; FT enrollment: 7,319)
Vassar College (about 23 miles; Poughkeepsie, NY ; FT enrollment: 2,469)
Marist College (about 24 miles; Poughkeepsie, NY ; FT enrollment: 5,536)
Public high school in Washingtonville:
Public elementary/middle schools in Washingtonville:
See full list of schools located in Washingtonville Library in Washingtonville: MOFFAT LIBRARY OF WASHINGTONVILLE Operating income: $616,347; Location: 6 WEST MAIN STREET; 32,683 books ; 1,904 e-books ; 1,772 audio materials ; 1,847 video materials ; 14 state licensed databases ; 16 other licensed databases ; 65 print serial subscriptions )
Birthplace of: Scott Pioli - Football player.
Orange County has a predicted average indoor radon screening level greater than 4 pCi/L (pico curies per liter) - Highest Potential Drinking water stations with addresses in Washingtonville and their reported violations in the past:
PINE BUSH BIBLE CAMP (Address: 124 MOFFAT ROAD Population served: 132, Groundwater):
Past health violations:
Treatment Technique (SWTR and GWR) - In JUN-2013, Contaminant: GROUNDWATER RULE. Follow-up actions: St Public Notif requested (JUL-12-2013), St Compliance achieved (JUL-12-2013), St Formal NOV issued (JUL-12-2013)
Past monitoring violations:
One routine major monitoring violation
3 regular monitoring violations
Population served: 25, Groundwater):
Past monitoring violations:
One routine major monitoring violation
One regular monitoring violation
Drinking water stations with addresses in Washingtonville that have no violations reported:
ROUND HILL HOUSE (Address: 110 ROUND HILL ROAD Population served: 150, Primary Water Source Type: Groundwater)
Average household size: This village:
2.7 peopleNew York:
2.6 people
Percentage of family households: This village:
69.5%Whole state:
63.5%
Percentage of households with unmarried partners: This village:
4.9%Whole state:
6.8%
Likely homosexual households (counted as self-reported same-sex unmarried-partner households)
Lesbian couples: 0.3% of all households Gay men: 0.3% of all households
7 people in group homes for juveniles (non-correctional) in 2010people in other noninstitutional facilities in 2010people in homes for the mentally ill in 2000people in other noninstitutional group quarters in 2000
Banks with branches in Washingtonville (2011 data):
JPMorgan Chase Bank, National Association: Washingtonville Branch at 7 West Main Street, branch established on 1965/04/26. Info updated 2011/11/10: Bank assets: $1,811,678.0 mil, Deposits: $1,190,738.0 mil, headquarters in Columbus, OH, positive income , International Specialization, 5577 total offices , Holding Company: Jpmorgan Chase & Co.
Walden Savings Bank: Washingtonville Branch at 127 East Main Street, branch established on 1973/04/30. Info updated 2011/07/21: Bank assets: $410.7 mil, Deposits: $368.1 mil, headquarters in Montgomery, NY, positive income , Commercial Lending Specialization, 11 total offices
Bank of America, National Association: Washingtonville Branch at 23 East Main Street, branch established on 1974/05/02. Info updated 2009/11/18: Bank assets: $1,451,969.3 mil, Deposits: $1,077,176.8 mil, headquarters in Charlotte, NC, positive income , 5782 total offices , Holding Company: Bank Of America Corporation
TD Bank, National Association: Washingtonville Branch at 21 East Main Street, branch established on 1999/03/26. Info updated 2010/10/04: Bank assets: $188,912.6 mil, Deposits: $153,149.8 mil, headquarters in Wilmington, DE, positive income , 1314 total offices , Holding Company: Toronto-Dominion Bank, The
For population 15 years and over in Washingtonville:
Never married: 36.0%Now married: 50.6%Separated: 0.8%Widowed: 4.8%Divorced: 7.7% For population 25 years and over in Washingtonville:
High school or higher: 89.6%Bachelor's degree or higher: 33.2%Graduate or professional degree: 9.7%Unemployed: 2.6%Mean travel time to work (commute): 36.4 minutes
Education Gini index (Inequality in education) Here:
11.0New York average:
13.9
Religion statistics for Washingtonville, NY (based on Orange County data)
Religion Adherents Congregations Catholic 131,308 45 Other 30,221 42 Mainline Protestant 19,326 88 Evangelical Protestant 14,437 95 Black Protestant 1,711 9 Orthodox 973 6 None 174,837 -
Source: Clifford Grammich, Kirk Hadaway, Richard Houseal, Dale E.Jones, Alexei Krindatch, Richie Stanley and Richard H.Taylor. 2012. 2010 U.S.Religion Census: Religious Congregations & Membership Study. Association of Statisticians of American Religious Bodies. Jones, Dale E., et al. 2002. Congregations and Membership in the United States 2000. Nashville, TN: Glenmary Research Center. Graphs represent county-level data
Food Environment Statistics: Number of grocery stores : 113This county :
3.00 / 10,000 pop.State :
4.13 / 10,000 pop.
Number of supercenters and club stores : 4Here :
0.11 / 10,000 pop.New York :
0.06 / 10,000 pop.
Number of convenience stores (no gas) : 46This county :
1.22 / 10,000 pop.State :
0.92 / 10,000 pop.
Number of convenience stores (with gas) : 94This county :
2.50 / 10,000 pop.New York :
1.68 / 10,000 pop.
Number of full-service restaurants : 314This county :
8.34 / 10,000 pop.New York :
8.82 / 10,000 pop.
Adult obesity rate : Orange County :
25.9%New York :
23.8%
Low-income preschool obesity rate : This county :
13.3%State :
15.6%
Health and Nutrition: Healthy diet rate : Washingtonville:
50.7%New York:
50.1%
Average overall health of teeth and gums : Washingtonville:
49.4%New York:
48.1%
People feeling badly about themselves : People not drinking alcohol at all : Average hours sleeping at night : Washingtonville:
6.8State:
6.8
Overweight people : Washingtonville:
35.1%New York:
33.4%
General health condition : Average condition of hearing : This city:
80.4%New York:
80.2%
More about Health and Nutrition of Washingtonville, NY Residents
Local government employment and payroll (March 2022)
Function
Full-time employees
Monthly full-time payroll
Average yearly full-time wage
Part-time employees
Monthly part-time payroll
Police Protection - Officers
14 $140,384 $120,329 6 $3,452 Streets and Highways
8 $46,976 $70,464 2 $3,583 Police - Other
2 $9,104 $54,624 2 $1,949 Financial Administration
2 $8,861 $53,166 5 $10,470 Parks and Recreation
0 $0 1 $281 Judicial and Legal
0 $0 1 $3,881
Totals for Government
26 $205,325 $94,765 17 $23,615
Washingtonville government finances - Expenditure in 2017 (per resident):
Construction - Sewerage: $489,000 ($85.86)
Current Operations - Police Protection: $1,777,000 ($312.03)
General - Other: $1,338,000 ($234.94)Sewerage: $612,000 ($107.46)Regular Highways: $586,000 ($102.90)Water Utilities: $428,000 ($75.15)Judicial and Legal Services: $130,000 ($22.83)Financial Administration: $107,000 ($18.79)Central Staff Services: $69,000 ($12.12)Parks and Recreation: $61,000 ($10.71)General Public Buildings: $44,000 ($7.73)Protective Inspection and Regulation - Other: $42,000 ($7.37)Solid Waste Management: $4,000 ($0.70)General - Interest on Debt: $28,000 ($4.92)
Other Capital Outlay - Sewerage: $72,000 ($12.64)
Regular Highways: $51,000 ($8.96)Water Utilities: $30,000 ($5.27)Police Protection: $24,000 ($4.21)General - Other: $6,000 ($1.05)Judicial and Legal Services: $5,000 ($0.88)Solid Waste Management: $1,000 ($0.18)Protective Inspection and Regulation - Other: $1,000 ($0.18)Parks and Recreation: $1,000 ($0.18)Total Salaries and Wages: $2,568,000 ($450.92)
Washingtonville government finances - Revenue in 2017 (per resident):
Charges - Sewerage: $747,000 ($131.17)
Parks and Recreation: $23,000 ($4.04)Other: $6,000 ($1.05)Local Intergovernmental - General Local Government Support: $910,000 ($159.79)
Other: $5,000 ($0.88)Miscellaneous - General Revenue - Other: $172,000 ($30.20)
Fines and Forfeits: $105,000 ($18.44)Revenue - Water Utilities: $434,000 ($76.21)
State Intergovernmental - General Local Government Support: $19,000 ($3.34)
Other: $10,000 ($1.76)Tax - Property: $3,298,000 ($579.10)
Public Utilities Sales: $164,000 ($28.80)Other License: $93,000 ($16.33)Other: $18,000 ($3.16)
Washingtonville government finances - Debt in 2017 (per resident):
Long Term Debt - Beginning Outstanding - Unspecified Public Purpose: $695,000 ($122.04)
Outstanding Unspecified Public Purpose: $590,000 ($103.60)Retired Unspecified Public Purpose: $105,000 ($18.44)Short Term Debt Outstanding - Beginning: $2,500,000 ($438.98)
End of Fiscal Year: $2,215,000 ($388.94)
Washingtonville government finances - Cash and Securities in 2017 (per resident):
Bond Funds - Cash and Securities: $316,000 ($55.49)
Other Funds - Cash and Securities: $1,067,000 ($187.36)
6.30% of this county's 2021 resident taxpayers lived in other counties in 2020 ($81,451 average adjusted gross income )
Here:
6.30%New York average:
5.29%
0.03% of residents moved from foreign countries ($369 average AGI )Orange County:
0.03%New York average:
0.01%
Top counties from which taxpayers relocated into this county between 2020 and 2021:
6.58% of this county's 2020 resident taxpayers moved to other counties in 2021 ($77,430 average adjusted gross income )
Here:
6.58%New York average:
6.93%
0.03% of residents moved to foreign countries ($315 average AGI )Orange County:
0.03%New York average:
0.02%
Top counties to which taxpayers relocated from this county between 2020 and 2021:
Businesses in Washingtonville, NY
Name Count Name Count
AutoZone 1 Stop & Shop 1 CVS 1 Subway 1 Dunkin Donuts 1 UPS 1 FedEx 1
Strongest AM radio stations in Washingtonville:
WGNY (1220 AM; 10 kW; NEWBURGH, NY; Owner: SUNRISE BROADCASTING LLC)
WWLE (1170 AM; daytime; 1 kW; CORNWALL, NY; Owner: 1170 BROADCAST RADIO, INC.)
WABC (770 AM; 50 kW; NEW YORK, NY; Owner: WABC-AM RADIO, INC.)
WFAN (660 AM; 50 kW; NEW YORK, NY; Owner: INFINITY BROADCASTING OPERATIONS, INC.)
WMCA (570 AM; 50 kW; NEW YORK, NY; Owner: SALEM MEDIA OF NEW YORK, LLC)
WOR (710 AM; 50 kW; NEW YORK, NY; Owner: BUCKLEY BROADCASTING CORPORATION)
WCBS (880 AM; 50 kW; NEW YORK, NY; Owner: INFINITY BROADCASTING OPERATIONS, INC.)
WINS (1010 AM; 50 kW; NEW YORK, NY; Owner: INFINITY BROADCASTING OPERATIONS, INC.)
WEPN (1050 AM; 50 kW; NEW YORK, NY; Owner: NEW YORK AM RADIO, LLC)
WSNR (620 AM; 20 kW; JERSEY CITY, NJ)
WVNJ (1160 AM; 20 kW; OAKLAND, NJ; Owner: UNIVERSAL B/CASTING OF NEW YORK,INC.)
WBBR (1130 AM; 50 kW; NEW YORK, NY; Owner: BLOOMBERG COMMUNICATIONS INC.)
WADO (1280 AM; 50 kW; NEW YORK, NY; Owner: WADO-AM LICENSE CORP.)
Strongest FM radio stations in Washingtonville:
WLJP (89.3 FM; MONROE, NY; Owner: SOUND OF LIFE, INC.)
WGNY-FM (103.1 FM; NEWBURGH, NY; Owner: SUNRISE BROADCASTING LLC)
WSPK (104.7 FM; POUGHKEEPSIE, NY; Owner: 6 JOHNSON ROAD LICENSES, INC.)
WFKP (99.3 FM; ELLENVILLE, NY; Owner: CLEAR CHANNEL BROADCASTING LICENSES, INC.)
WPDH (101.5 FM; POUGHKEEPSIE, NY; Owner: CUMULUS LICENSING CORP.)
W202AR (88.3 FM; NEWBURGH, NY; Owner: SOUND OF LIFE, INC.)
W299AG (107.7 FM; NEWBURGH, NY; Owner: WAMC)
W272AV (102.3 FM; NEWBURGH, NY; Owner: JOHN KATONAH)
WFNP (88.7 FM; ROSENDALE, NY; Owner: STATE UNIVERSITY OF NEW YORK)
WRHV (88.7 FM; POUGHKEEPSIE, NY; Owner: WMHT EDUCATIONAL TELECOMMUNICATIONS)
WBWZ (93.3 FM; NEW PALTZ, NY; Owner: CLEVELAND RADIO LICENSES, LLC)
WRWD-FM (107.3 FM; HIGHLAND, NY; Owner: CLEVELAND RADIO LICENSES, LLC)
WCZX (97.7 FM; HYDE PARK, NY; Owner: CUMULUS LICENSING CORP.)
WRRB (96.9 FM; ARLINGTON, NY; Owner: CUMULUS LICENSING CORP.)
WRNQ (92.1 FM; POUGHKEEPSIE, NY; Owner: CLEAR CHANNEL BROADCASTING LICENSES, INC.)
WHUD (100.7 FM; PEEKSKILL, NY; Owner: 6 JOHNSON ROAD LICENSES, INC.)
W292CM (106.3 FM; POUGHKEEPSIE, NY; Owner: JOHN KATONAH)
WPLJ (95.5 FM; NEW YORK, NY; Owner: WPLJ-FM RADIO, INC.)
WZAD (97.3 FM; WURTSBORO, NY; Owner: CUMULUS LICENSING CORP.)
WXHD (90.1 FM; MOUNT HOPE, NY; Owner: AURICLE COMMUNICATIONS)
TV broadcast stations around Washingtonville:
WTBY (Channel 54; POUGHKEEPSIE, NY; Owner: TRINITY BROADCASTING OF NEW YORK, INC.)
WFME-TV (Channel 66; WEST MILFORD, NJ; Owner: FAMILY STATIONS, INC.)
WNYW (Channel 5; NEW YORK, NY; Owner: FOX TELEVISION STATIONS, INC.)
WRNN-TV (Channel 62; KINGSTON, NY; Owner: WRNN-TV ASSOCIATES LIMITED PARTNERSHIP)
WCBS-TV (Channel 2; NEW YORK, NY; Owner: CBS BROADCASTING INC.)
WABC-TV (Channel 7; NEW YORK, NY; Owner: AMERICAN BROADCASTING COMPANIES, INC)
WPIX (Channel 11; NEW YORK, NY; Owner: WPIX, INC.)
WWOR-TV (Channel 9; SECAUCUS, NJ; Owner: FOX TELEVISION STATIONS, INC.)
WNJU (Channel 47; LINDEN, NJ; Owner: WNJU LICENSE CORPORATION)
WPXN-TV (Channel 31; NEW YORK, NY; Owner: PAXSON COMMUNICATIONS LICENSE COMPANY, LLC)
WFUT (Channel 68; NEWARK, NJ; Owner: UNIVISION NEW YORK LLC)
WNBC (Channel 4; NEW YORK, NY; Owner: NATIONAL BROADCASTING COMPANY, INC.)
WNET (Channel 13; NEWARK, NJ; Owner: EDUCATIONAL BROADCASTING CORPORATION)
WXTV (Channel 41; PATERSON, NJ; Owner: WXTV LICENSE PARTNERSHIP, G.P.)
WXNY-LP (Channel 32; NEW YORK, NY; Owner: ISLAND BROADCASTING COMPANY)
WNYE-TV (Channel 25; NEW YORK, NY; Owner: NEW YORK CITY BOARD OF EDUCATION)
WPXO-LP (Channel 34; EAST ORANGE, NJ; Owner: PAXSON COMMUNICATIONS LPTV, INC.)
WKOB-LP (Channel 53; NEW YORK, NY; Owner: WKOB COMMUNICATIONS, INC.)
W68DN (Channel 68; CHERRY HILL, ETC., NJ; Owner: MARCIA COHEN)
Washingtonville fatal accident statistics for 1975 - 2021
Washingtonville fatal accident list:
May 1, 1998 08:51 AM, Sr-208, Vehicles: 2, Persons: 7, Fatalities: 1Vehicles: 1, Persons: 2, Fatalities: 1Vehicles: 1, Persons: 2, Fatalities: 1Vehicles: 1, Persons: 2, Fatalities: 1Vehicles: 1, Persons: 2, Fatalities: 1, Drunk persons involved: 1
National Bridge Inventory (NBI) Statistics 3 Number of bridges33ft / 10.4m Total length $6,442,000 Total costs7,975 Total average daily traffic242 Total average daily truck traffic9,992 Total future (year 2038) average daily traffic
FCC Registered Antenna Towers: 11 (
See the full list of FCC Registered Antenna Towers in Washingtonville )
FCC Registered Broadcast Land Mobile Towers: 7
Rt 94 2000 S Of Rt 208 (Lat: 41.423972 Lon: -74.171806), Type: Bant, Structure height: 24 m, Overall height: 27 m, Call Sign: KJS810, Assigned Frequencies: 151.040 MHz, Grant Date: 04/28/2023, Expiration Date: 05/10/2033, Registrant: New York Communications Co. Inc., 53 W. Cedar St., Poughkeepsie, NY 12601, Phone: (845) 471-5520, Fax: (845) 471-5593, Email:
Main St (Lat: 41.427028 Lon: -74.181250), Call Sign: WYV215, Assigned Frequencies: 158.977 MHz, 155.610 MHz, Grant Date: 01/28/2014, Expiration Date: 03/10/2024, Registrant: Goosetown Communications, 50 N. Harrison Ave, Congers, NY 10920, Phone: (845) 268-7500, Fax: (845) 268-5345, Email:
Clinton Water Tank (Lat: 41.439250 Lon: -74.144028), Type: Tank, Structure height: 10 m, Overall height: 15 m, Call Sign: WPCP817, Assigned Frequencies: 453.550 MHz, Grant Date: 01/29/2015, Expiration Date: 04/28/2025, Certifier: James B Skelly, Registrant: Washingtonville Fd, 89 East Main Street, Washingtonville, NY 10992, Phone: (845) 496-8591, Fax: (845) 497-3301, Email:
Hallock Dr (Lat: 41.429250 Lon: -74.153472), Call Sign: KBJ827, Licensee ID: L00024903, Assigned Frequencies: 35.8600 MHz, Grant Date: 03/11/1999, Expiration Date: 02/28/2004, Cancellation Date: 05/02/2004, Registrant: Coleman Gas Service Inc, Hallock Dr, Washingtonville, NY 10992 24 W. Main St (Lat: 41.427611 Lon: -74.167694), Call Sign: WQCG439, Assigned Frequencies: 469.212 MHz, 469.037 MHz, 469.262 MHz, 469.087 MHz, 469.287 MHz, 469.112 MHz, 469.312 MHz, 469.137 MHz, 469.337 MHz, 469.162 MHz... (+15 more), Grant Date: 02/25/2005, Expiration Date: 02/25/2015, Cancellation Date: 03/03/2006, Certifier: Keith D Berlin, Registrant: Panasonic System Solucations Company, 1707 N. Randall Road, E1-D9, Elgin, IL 60123-7847, Phone: (847) 468-5318, Fax: (847) 574-7614, Email:
30 W Main Street (Lat: 41.428611 Lon: -74.162806), Call Sign: WQEB635, Assigned Frequencies: 469.212 MHz, 469.037 MHz, 469.237 MHz, 469.062 MHz, 469.262 MHz, 469.087 MHz, 469.287 MHz, 469.112 MHz, 469.312 MHz, 469.137 MHz... (+21 more), Grant Date: 12/21/2005, Expiration Date: 12/21/2015, Cancellation Date: 02/20/2016, Certifier: Jodi A Sardinha, Registrant: Panasonic System Solutions Company, 1707 N. Randall Rd, E1-D9, Elgin, IL 60123-7847, Phone: (847) 468-5318, Fax: (847) 574-7614, Email:
Lat: 41.428694 Lon: -74.164583, Call Sign: WQJL671, Assigned Frequencies: 453.787 MHz, 458.787 MHz, Grant Date: 12/03/2018, Expiration Date: 10/24/2028, Certifier: Wayne M Schutz, Registrant: Business Radio Licensing, 30251 Golden Lantern, Suite E # 501, Laguna Niguel, CA 92677, Phone: (949) 348-8510, Fax: (949) 348-8514, Email:
FCC Registered Amateur Radio Licenses: 36 (
See the full list of FCC Registered Amateur Radio Licenses in Washingtonville )
FAA Registered Aircraft: 9 (
See the full list of FAA Registered Aircraft in Washingtonville )
Home Mortgage Disclosure Act Aggregated Statistics For Year 2009(Based on 1 partial tract) A) FHA, FSA/RHS & VA B) Conventional C) Refinancings D) Home Improvement Loans F) Non-occupant Loans on G) Loans On Manufactured Number Average Value Number Average Value Number Average Value Number Average Value Number Average Value Number Average Value
LOANS ORIGINATED 9 $303,828 12 $180,537 39 $217,261 4 $123,338 1 $274,990 2 $32,820 APPLICATIONS APPROVED, NOT ACCEPTED 2 $175,030 0 $0 3 $232,947 0 $0 0 $0 0 $0 APPLICATIONS DENIED 5 $233,720 2 $96,955 24 $271,700 2 $82,370 2 $94,165 0 $0 APPLICATIONS WITHDRAWN 1 $312,310 2 $117,760 15 $236,236 1 $132,130 0 $0 0 $0 FILES CLOSED FOR INCOMPLETENESS 0 $0 2 $165,810 3 $190,477 0 $0 0 $0 1 $34,750
Aggregated Statistics For Year 2008(Based on 1 partial tract) A) FHA, FSA/RHS & VA B) Conventional C) Refinancings D) Home Improvement Loans F) Non-occupant Loans on G) Loans On Manufactured Number Average Value Number Average Value Number Average Value Number Average Value Number Average Value Number Average Value
LOANS ORIGINATED 4 $282,710 24 $240,455 27 $213,451 3 $82,083 2 $204,635 3 $58,343 APPLICATIONS APPROVED, NOT ACCEPTED 0 $0 1 $204,630 8 $226,459 2 $99,530 0 $0 0 $0 APPLICATIONS DENIED 0 $0 8 $230,266 35 $267,880 4 $91,270 2 $183,400 2 $52,340 APPLICATIONS WITHDRAWN 1 $359,070 3 $257,973 19 $271,444 1 $8,580 0 $0 0 $0 FILES CLOSED FOR INCOMPLETENESS 0 $0 2 $157,870 3 $225,367 1 $62,630 0 $0 1 $30,030
Aggregated Statistics For Year 2007(Based on 1 partial tract) A) FHA, FSA/RHS & VA B) Conventional C) Refinancings D) Home Improvement Loans F) Non-occupant Loans on G) Loans On Manufactured Number Average Value Number Average Value Number Average Value Number Average Value Number Average Value Number Average Value
LOANS ORIGINATED 2 $235,950 38 $229,447 47 $216,855 16 $97,839 4 $163,235 0 $0 APPLICATIONS APPROVED, NOT ACCEPTED 0 $0 5 $275,932 18 $248,796 3 $80,793 1 $250,540 1 $40,760 APPLICATIONS DENIED 0 $0 9 $224,796 41 $239,476 9 $73,979 1 $186,620 2 $31,530 APPLICATIONS WITHDRAWN 0 $0 9 $206,588 13 $228,327 2 $132,990 0 $0 1 $18,880 FILES CLOSED FOR INCOMPLETENESS 0 $0 4 $236,272 8 $288,502 0 $0 0 $0 0 $0
Aggregated Statistics For Year 2006(Based on 1 partial tract) A) FHA, FSA/RHS & VA B) Conventional C) Refinancings D) Home Improvement Loans F) Non-occupant Loans on G) Loans On Manufactured Number Average Value Number Average Value Number Average Value Number Average Value Number Average Value Number Average Value
LOANS ORIGINATED 1 $227,800 62 $219,260 66 $191,256 24 $68,819 1 $155,730 2 $50,410 APPLICATIONS APPROVED, NOT ACCEPTED 0 $0 6 $197,840 17 $165,392 3 $101,673 0 $0 1 $57,490 APPLICATIONS DENIED 0 $0 9 $206,921 49 $216,295 15 $99,099 1 $284,860 3 $39,323 APPLICATIONS WITHDRAWN 0 $0 10 $229,429 45 $214,395 4 $66,925 2 $216,860 0 $0 FILES CLOSED FOR INCOMPLETENESS 0 $0 1 $263,410 7 $278,973 0 $0 0 $0 0 $0
Aggregated Statistics For Year 2005(Based on 1 partial tract) A) FHA, FSA/RHS & VA B) Conventional C) Refinancings D) Home Improvement Loans F) Non-occupant Loans on G) Loans On Manufactured Number Average Value Number Average Value Number Average Value Number Average Value Number Average Value Number Average Value
LOANS ORIGINATED 1 $257,830 62 $239,237 91 $192,946 14 $93,736 3 $149,007 1 $36,460 APPLICATIONS APPROVED, NOT ACCEPTED 0 $0 8 $216,216 12 $212,283 2 $73,575 0 $0 1 $30,460 APPLICATIONS DENIED 0 $0 13 $181,929 44 $216,489 12 $52,481 1 $251,820 3 $39,323 APPLICATIONS WITHDRAWN 0 $0 16 $219,782 65 $208,124 7 $189,496 2 $205,490 0 $0 FILES CLOSED FOR INCOMPLETENESS 0 $0 3 $142,000 9 $259,402 1 $19,310 0 $0 1 $34,750
Aggregated Statistics For Year 2004(Based on 1 partial tract) A) FHA, FSA/RHS & VA B) Conventional C) Refinancings D) Home Improvement Loans F) Non-occupant Loans on G) Loans On Manufactured Number Average Value Number Average Value Number Average Value Number Average Value Number Average Value Number Average Value
LOANS ORIGINATED 1 $142,860 55 $190,460 84 $184,199 17 $81,308 6 $146,288 4 $43,865 APPLICATIONS APPROVED, NOT ACCEPTED 0 $0 9 $169,884 17 $167,562 6 $61,347 1 $179,320 2 $43,760 APPLICATIONS DENIED 0 $0 12 $148,934 49 $187,403 17 $45,373 3 $179,750 6 $64,850 APPLICATIONS WITHDRAWN 0 $0 6 $264,978 57 $195,278 6 $141,355 1 $181,900 0 $0 FILES CLOSED FOR INCOMPLETENESS 0 $0 2 $183,185 8 $204,044 1 $30,890 0 $0 0 $0
Aggregated Statistics For Year 2003(Based on 1 partial tract) A) FHA, FSA/RHS & VA B) Conventional C) Refinancings D) Home Improvement Loans F) Non-occupant Loans on Number Average Value Number Average Value Number Average Value Number Average Value Number Average Value
LOANS ORIGINATED 3 $204,347 64 $181,259 202 $158,055 11 $32,019 3 $126,270 APPLICATIONS APPROVED, NOT ACCEPTED 0 $0 10 $111,540 36 $152,283 3 $47,190 0 $0 APPLICATIONS DENIED 0 $0 15 $107,651 76 $163,477 9 $33,271 2 $191,550 APPLICATIONS WITHDRAWN 1 $213,210 7 $191,150 43 $176,848 3 $25,027 2 $143,070 FILES CLOSED FOR INCOMPLETENESS 0 $0 2 $125,695 11 $183,729 0 $0 0 $0
Aggregated Statistics For Year 2002(Based on 1 partial tract) B) Conventional C) Refinancings D) Home Improvement Loans F) Non-occupant Loans on Number Average Value Number Average Value Number Average Value Number Average Value
LOANS ORIGINATED 65 $171,534 120 $135,371 15 $38,009 3 $131,130 APPLICATIONS APPROVED, NOT ACCEPTED 9 $115,734 27 $142,190 3 $16,587 0 $0 APPLICATIONS DENIED 15 $93,579 51 $121,609 13 $46,530 2 $131,490 APPLICATIONS WITHDRAWN 7 $201,263 42 $150,875 4 $66,495 0 $0 FILES CLOSED FOR INCOMPLETENESS 3 $155,583 12 $158,229 0 $0 0 $0
Aggregated Statistics For Year 2001(Based on 1 partial tract) A) FHA, FSA/RHS & VA B) Conventional C) Refinancings D) Home Improvement Loans F) Non-occupant Loans on Number Average Value Number Average Value Number Average Value Number Average Value Number Average Value
LOANS ORIGINATED 5 $123,980 86 $147,835 77 $118,560 13 $39,435 1 $199,910 APPLICATIONS APPROVED, NOT ACCEPTED 0 $0 11 $129,636 9 $94,761 5 $38,010 0 $0 APPLICATIONS DENIED 0 $0 14 $46,240 37 $98,264 11 $28,704 2 $108,325 APPLICATIONS WITHDRAWN 1 $129,990 12 $137,852 31 $128,825 8 $34,105 1 $64,350 FILES CLOSED FOR INCOMPLETENESS 0 $0 2 $74,860 9 $126,412 1 $25,740 0 $0
Aggregated Statistics For Year 2000(Based on 1 partial tract) A) FHA, FSA/RHS & VA B) Conventional C) Refinancings D) Home Improvement Loans F) Non-occupant Loans on Number Average Value Number Average Value Number Average Value Number Average Value Number Average Value
LOANS ORIGINATED 6 $136,493 75 $123,889 17 $89,939 11 $26,910 1 $78,940 APPLICATIONS APPROVED, NOT ACCEPTED 1 $144,140 10 $119,348 8 $121,408 6 $46,332 0 $0 APPLICATIONS DENIED 0 $0 22 $59,436 16 $83,119 12 $35,321 0 $0 APPLICATIONS WITHDRAWN 2 $172,245 7 $130,477 20 $98,906 3 $91,520 0 $0 FILES CLOSED FOR INCOMPLETENESS 0 $0 1 $83,660 8 $125,321 0 $0 0 $0
Aggregated Statistics For Year 1999(Based on 1 partial tract) A) FHA, FSA/RHS & VA B) Conventional C) Refinancings D) Home Improvement Loans F) Non-occupant Loans on Number Average Value Number Average Value Number Average Value Number Average Value Number Average Value
LOANS ORIGINATED 5 $138,262 60 $122,545 38 $111,598 9 $19,336 5 $89,210 APPLICATIONS APPROVED, NOT ACCEPTED 1 $136,020 10 $81,567 10 $128,288 2 $54,190 3 $102,193 APPLICATIONS DENIED 1 $196,470 11 $97,469 24 $78,408 7 $22,700 3 $85,783 APPLICATIONS WITHDRAWN 1 $179,200 6 $155,737 25 $93,580 2 $31,305 0 $0 FILES CLOSED FOR INCOMPLETENESS 0 $0 1 $215,040 5 $109,590 0 $0 0 $0
Detailed HMDA statistics for the following Tracts:
0132.00
Private Mortgage Insurance Companies Aggregated Statistics For Year 2009(Based on 1 partial tract) A) Conventional B) Refinancings Number Average Value Number Average Value
LOANS ORIGINATED 3 $206,350 2 $301,375 APPLICATIONS APPROVED, NOT ACCEPTED 1 $293,440 0 $0 APPLICATIONS DENIED 2 $191,550 0 $0 APPLICATIONS WITHDRAWN 0 $0 0 $0 FILES CLOSED FOR INCOMPLETENESS 0 $0 0 $0
Aggregated Statistics For Year 2008(Based on 1 partial tract) A) Conventional B) Refinancings Number Average Value Number Average Value
LOANS ORIGINATED 11 $278,304 1 $332,470 APPLICATIONS APPROVED, NOT ACCEPTED 3 $224,653 3 $270,557 APPLICATIONS DENIED 1 $383,100 1 $267,700 APPLICATIONS WITHDRAWN 0 $0 0 $0 FILES CLOSED FOR INCOMPLETENESS 0 $0 1 $249,680
Aggregated Statistics For Year 2007(Based on 1 partial tract) A) Conventional B) Refinancings Number Average Value Number Average Value
LOANS ORIGINATED 11 $258,960 3 $319,177 APPLICATIONS APPROVED, NOT ACCEPTED 2 $322,610 1 $227,370 APPLICATIONS DENIED 0 $0 0 $0 APPLICATIONS WITHDRAWN 1 $192,190 0 $0 FILES CLOSED FOR INCOMPLETENESS 0 $0 0 $0
Aggregated Statistics For Year 2006(Based on 1 partial tract) A) Conventional B) Refinancings Number Average Value Number Average Value
LOANS ORIGINATED 5 $253,282 2 $317,675 APPLICATIONS APPROVED, NOT ACCEPTED 2 $217,075 2 $306,735 APPLICATIONS DENIED 0 $0 0 $0 APPLICATIONS WITHDRAWN 0 $0 0 $0 FILES CLOSED FOR INCOMPLETENESS 0 $0 0 $0
Aggregated Statistics For Year 2005(Based on 1 partial tract) A) Conventional B) Refinancings Number Average Value Number Average Value
LOANS ORIGINATED 10 $289,361 3 $182,327 APPLICATIONS APPROVED, NOT ACCEPTED 4 $285,392 2 $260,830 APPLICATIONS DENIED 0 $0 0 $0 APPLICATIONS WITHDRAWN 0 $0 0 $0 FILES CLOSED FOR INCOMPLETENESS 0 $0 0 $0
Aggregated Statistics For Year 2004(Based on 1 partial tract) A) Conventional B) Refinancings C) Non-occupant Loans on Number Average Value Number Average Value Number Average Value
LOANS ORIGINATED 12 $215,537 1 $199,910 1 $104,250 APPLICATIONS APPROVED, NOT ACCEPTED 3 $255,970 1 $357,790 0 $0 APPLICATIONS DENIED 0 $0 0 $0 0 $0 APPLICATIONS WITHDRAWN 1 $121,840 0 $0 0 $0 FILES CLOSED FOR INCOMPLETENESS 0 $0 1 $125,700 0 $0
Aggregated Statistics For Year 2003(Based on 1 partial tract) A) Conventional B) Refinancings Number Average Value Number Average Value
LOANS ORIGINATED 18 $204,323 11 $227,136 APPLICATIONS APPROVED, NOT ACCEPTED 4 $179,538 5 $228,742 APPLICATIONS DENIED 0 $0 0 $0 APPLICATIONS WITHDRAWN 0 $0 2 $140,285 FILES CLOSED FOR INCOMPLETENESS 0 $0 0 $0
Aggregated Statistics For Year 2002(Based on 1 partial tract) A) Conventional B) Refinancings Number Average Value Number Average Value
LOANS ORIGINATED 29 $198,923 11 $192,699 APPLICATIONS APPROVED, NOT ACCEPTED 8 $168,329 3 $158,873 APPLICATIONS DENIED 1 $148,430 1 $152,290 APPLICATIONS WITHDRAWN 3 $127,270 1 $264,690 FILES CLOSED FOR INCOMPLETENESS 1 $96,100 0 $0
Aggregated Statistics For Year 2001(Based on 1 partial tract) A) Conventional B) Refinancings Number Average Value Number Average Value
LOANS ORIGINATED 42 $167,147 8 $161,196 APPLICATIONS APPROVED, NOT ACCEPTED 9 $169,408 3 $199,913 APPLICATIONS DENIED 0 $0 0 $0 APPLICATIONS WITHDRAWN 1 $153,580 0 $0 FILES CLOSED FOR INCOMPLETENESS 0 $0 0 $0
Aggregated Statistics For Year 2000(Based on 1 partial tract) A) Conventional B) Refinancings Number Average Value Number Average Value
LOANS ORIGINATED 26 $143,550 1 $221,360 APPLICATIONS APPROVED, NOT ACCEPTED 3 $169,313 0 $0 APPLICATIONS DENIED 0 $0 0 $0 APPLICATIONS WITHDRAWN 0 $0 0 $0 FILES CLOSED FOR INCOMPLETENESS 0 $0 0 $0
Aggregated Statistics For Year 1999(Based on 1 partial tract) A) Conventional B) Refinancings C) Non-occupant Loans on Number Average Value Number Average Value Number Average Value
LOANS ORIGINATED 25 $140,991 8 $134,236 1 $74,700 APPLICATIONS APPROVED, NOT ACCEPTED 5 $150,526 2 $146,165 0 $0 APPLICATIONS DENIED 2 $137,095 0 $0 0 $0 APPLICATIONS WITHDRAWN 0 $0 0 $0 0 $0 FILES CLOSED FOR INCOMPLETENESS 0 $0 0 $0 0 $0
Detailed PMIC statistics for the following Tracts:
0132.00
Most common first names in Washingtonville, NY among deceased individuals Name Count Lived (average)
John 54 73.2 years Mary 48 77.7 years Robert 29 68.9 years Joseph 28 75.4 years William 27 76.6 years Anna 25 80.5 years James 24 70.6 years Helen 23 77.3 years Margaret 20 78.6 years George 19 74.3 years
Most common last names in Washingtonville, NY among deceased individuals Last name Count Lived (average)
Brown 12 70.3 years Smith 11 75.6 years Lewis 8 75.0 years Dolson 8 71.0 years Wood 7 76.6 years Jones 6 81.7 years Cooper 5 71.0 years Lindsell 5 69.6 years Miller 5 70.8 years Felter 5 76.4 years
Washingtonville compared to New York state average:
Unemployed percentage significantly below state average. Foreign-born population percentage significantly below state average. Renting percentage below state average. House age below state average. Washingtonville on our top lists :
#26 on the list of "Top 100 cities with longest commuting times (pop. 5,000+)"
#69 on the list of "Top 101 cities with the lowest number of burglaries per 100,000 residents (population 5,000+)"
#92 on the list of "Top 101 cities with largest percentage of males in industries: real estate and rental and leasing (population 5,000+)"
#92 on the list of "Top 101 cities with the most residents born in Other Southern Europe (population 500+)"
#5 on the list of "Top 101 counties with the largest increase in the number of infant deaths per 1000 residents 2000-2006 to 2007-2013 (pop. 50,000+)"
#21 on the list of "Top 101 counties with the lowest Ozone (1-hour) air pollution readings in 2012 (ppm)"
#67 on the list of "Top 101 counties with the largest number of people moving out compared to moving in (pop. 50,000+)"
#79 on the list of "Top 101 counties with the most Catholic congregations"
#90 on the list of "Top 101 counties with the most Other adherents (pop. 50,000+)"
Top Patent Applicants
Brian M. Siegel (4)
Scott W. Gisler (4)
Louis J. Lombardo (4)
John Witte (3)
Terrance Snyder (3)
John Divirgilio (2)
Scott William Gisler (2)
Vincent Gennarelli (1)
Brian Siegel (1)
Thomas G. Kluck (1)
Total of 37 patent applications in 2008-2024.


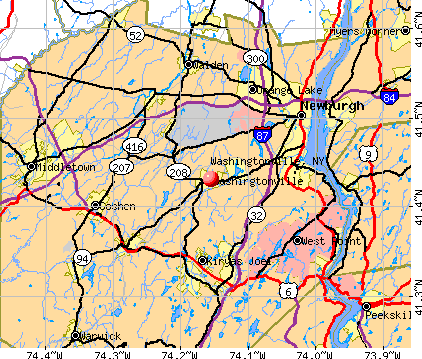


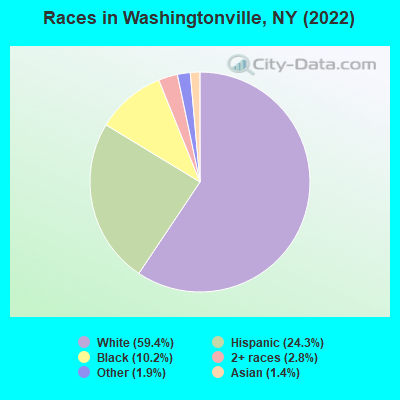
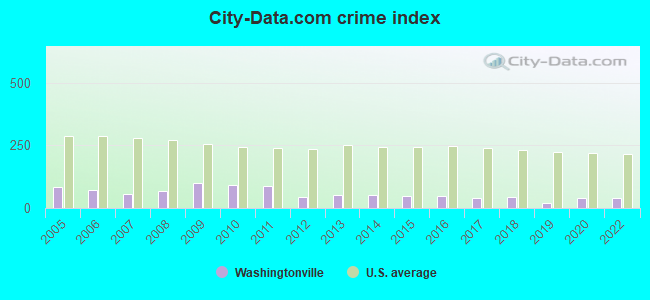
 Recent articles from our blog. Our writers, many of them Ph.D. graduates or candidates, create easy-to-read articles on a wide variety of topics.


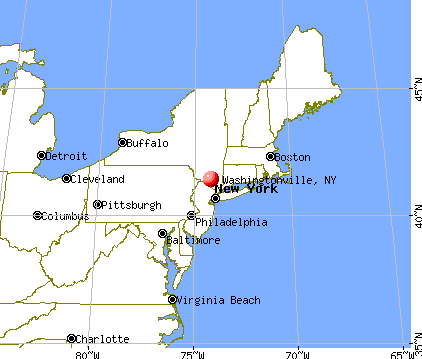
 (21.7 miles
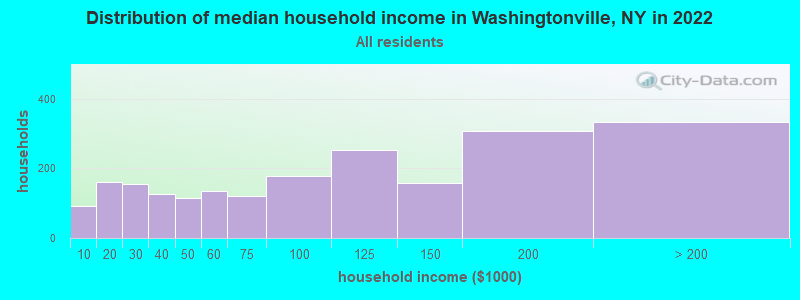
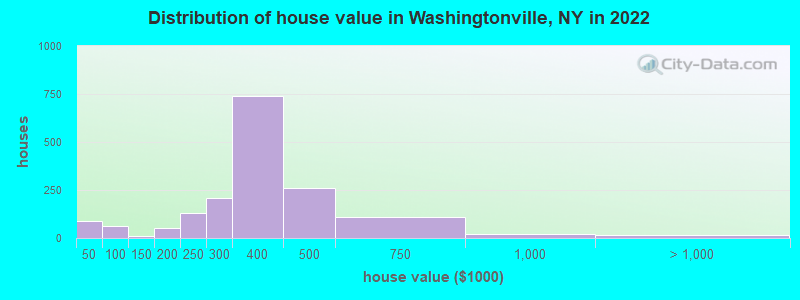
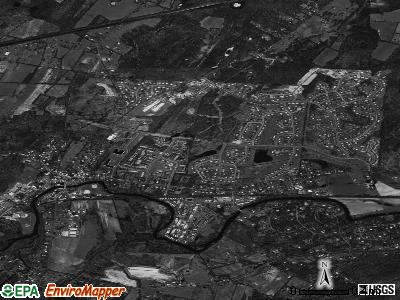
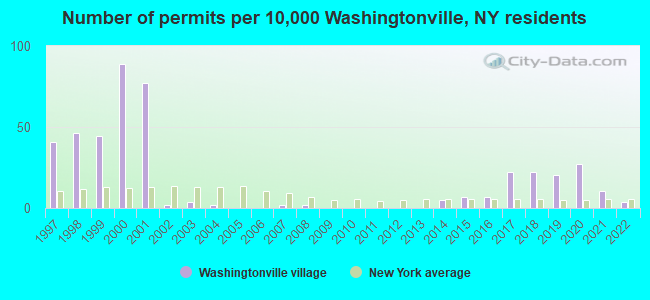
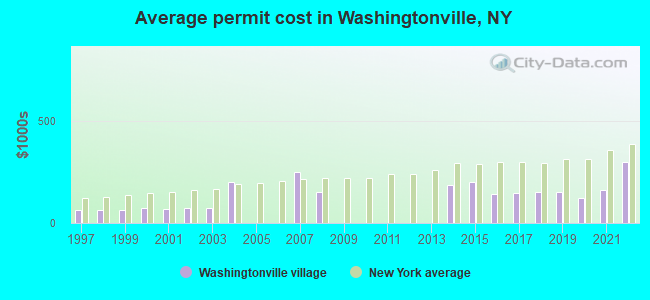
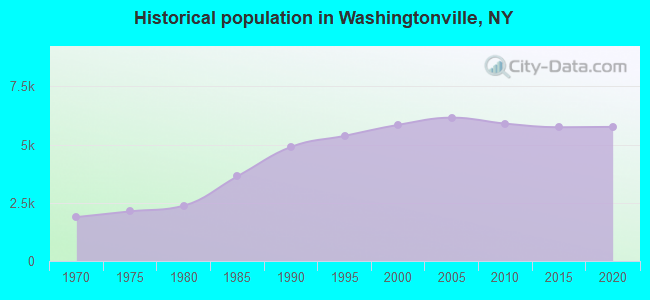
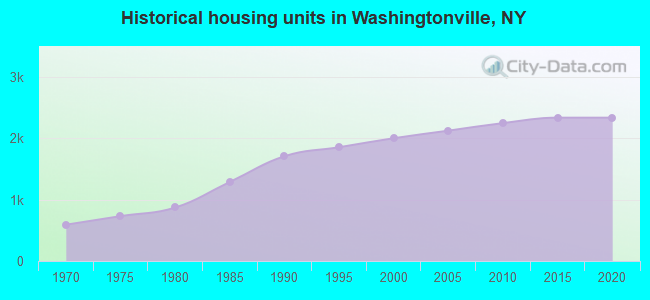
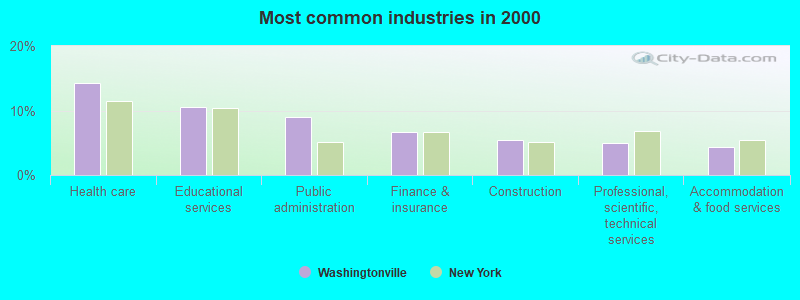
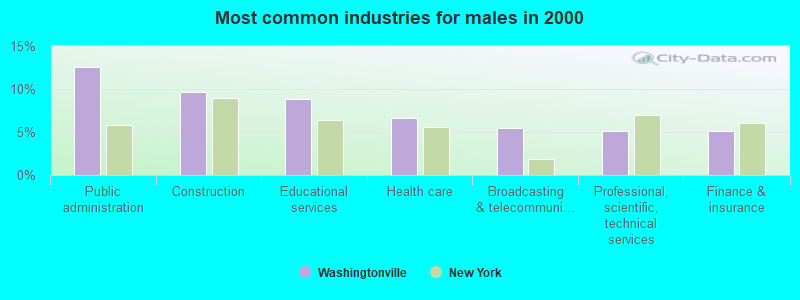
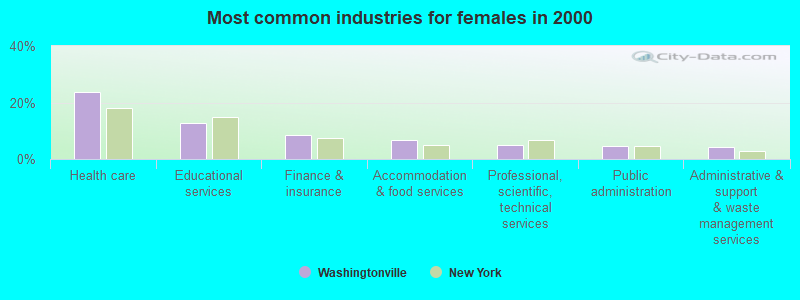
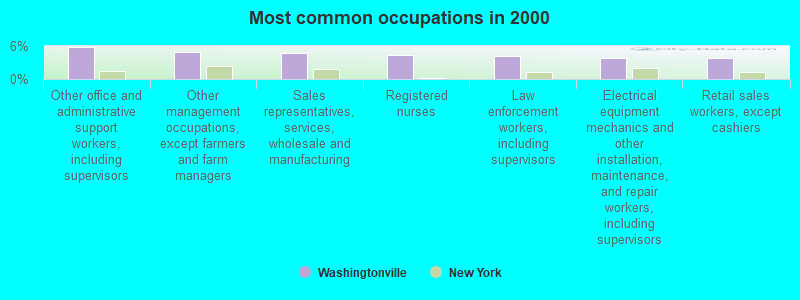
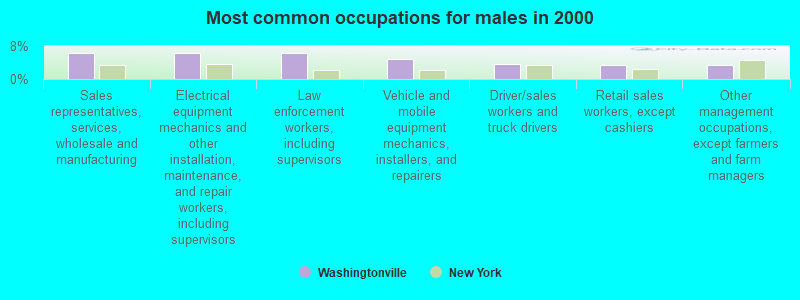
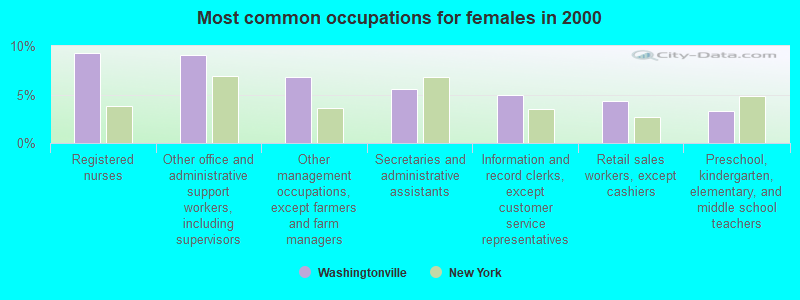
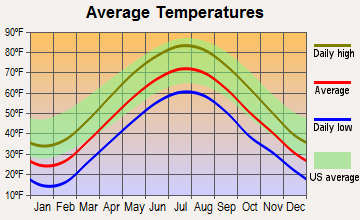
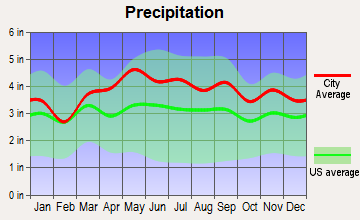
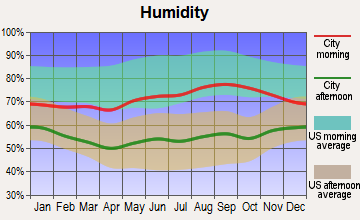
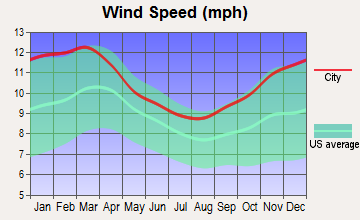
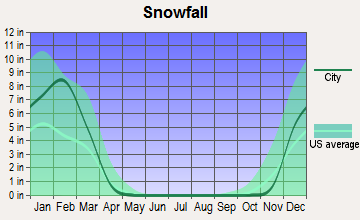
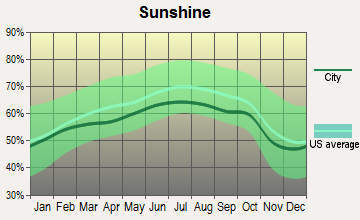
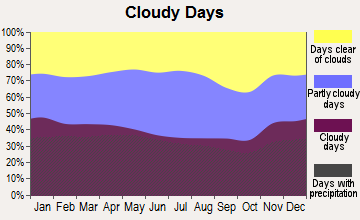
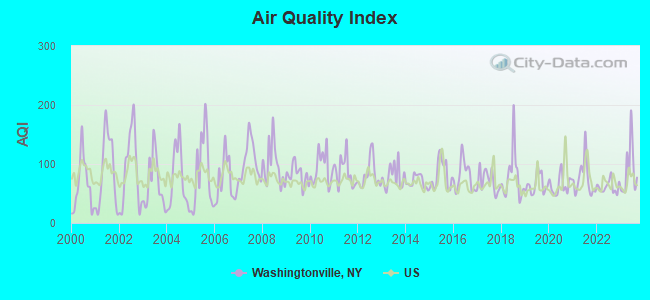
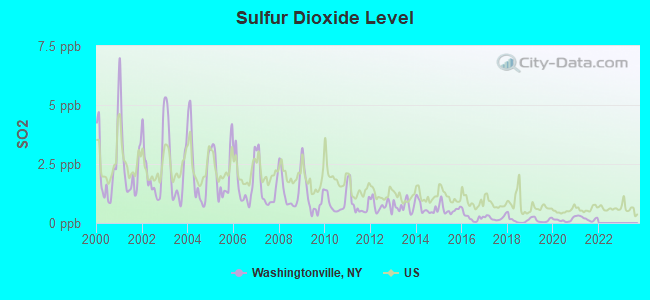
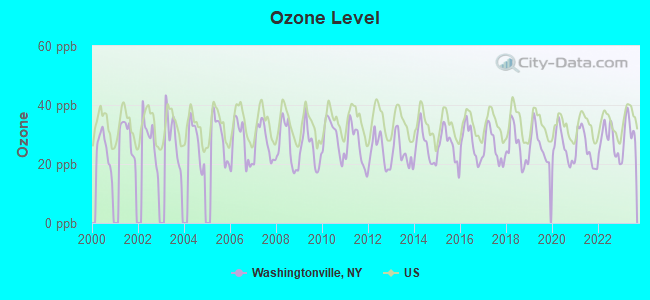
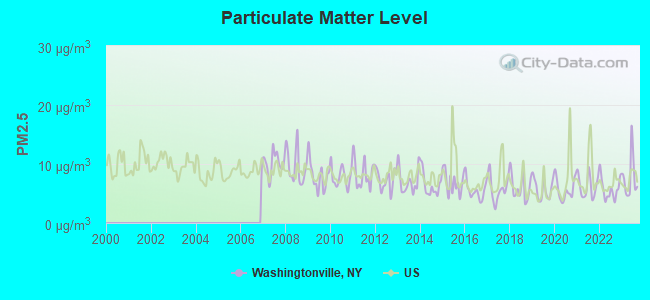
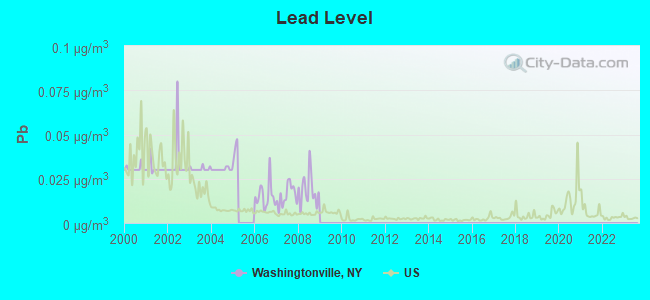
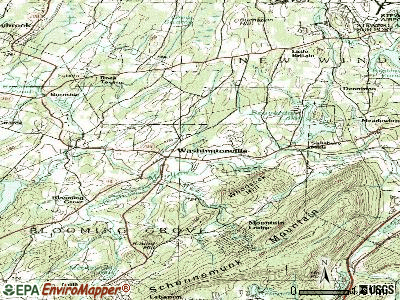
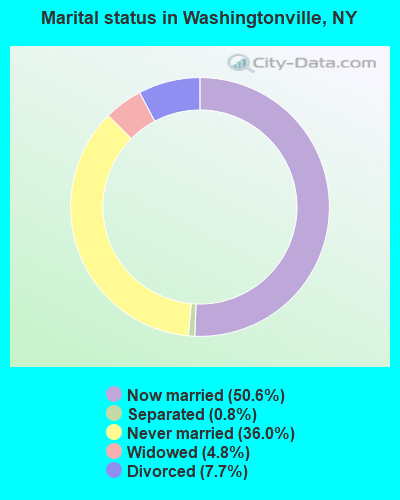
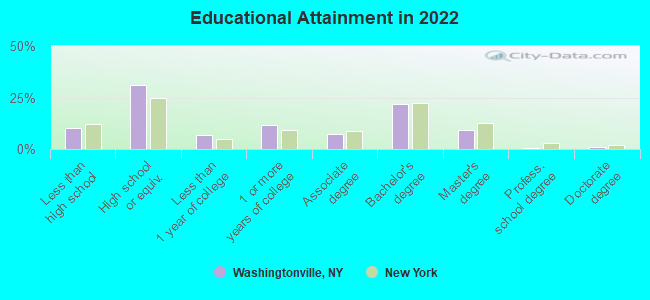
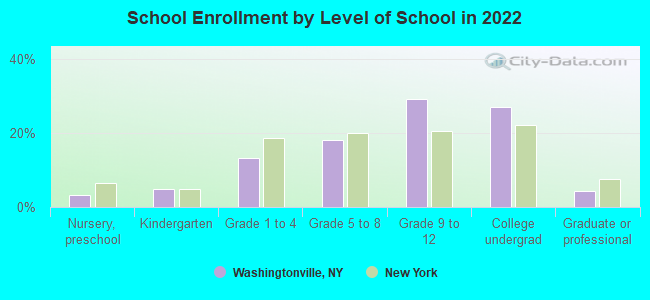
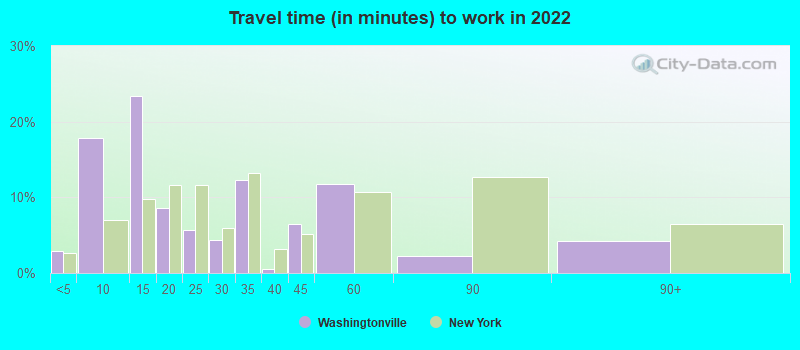
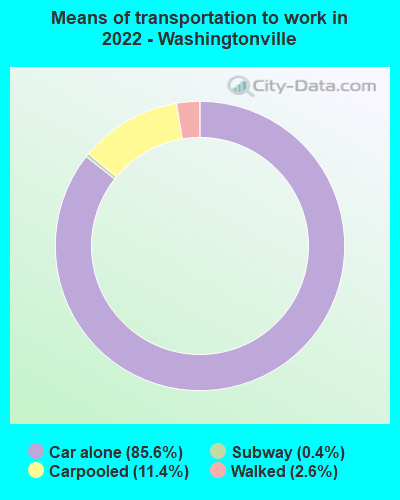
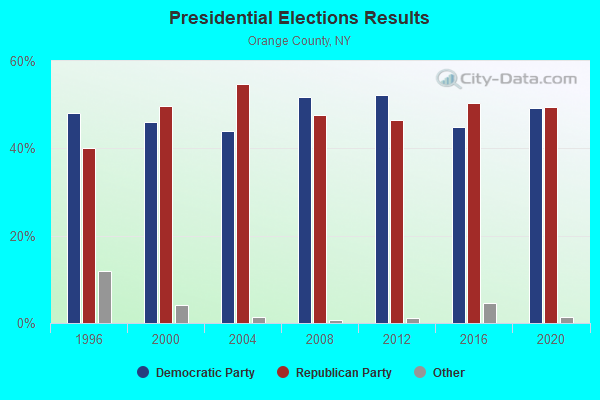
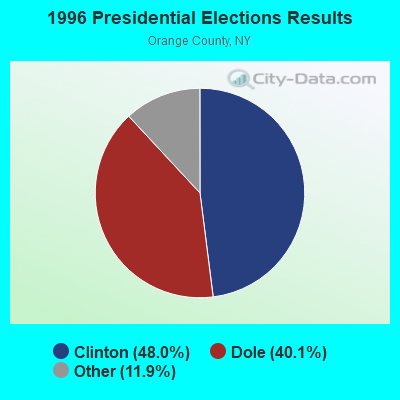
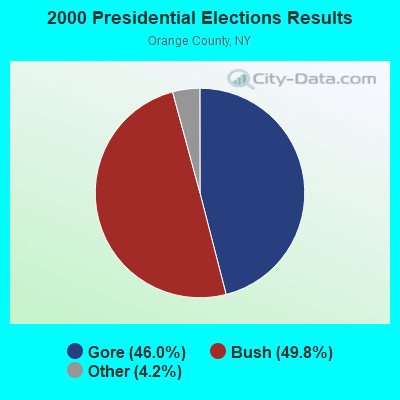
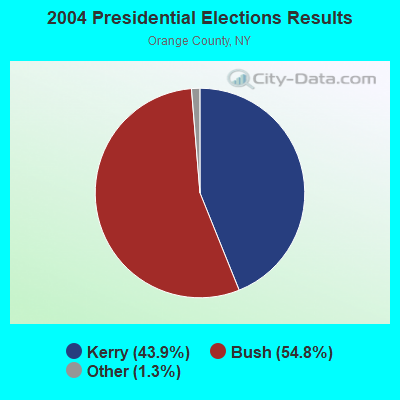
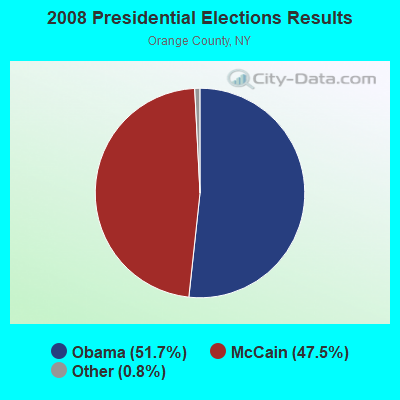
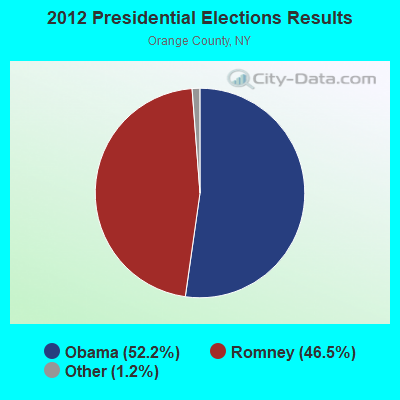
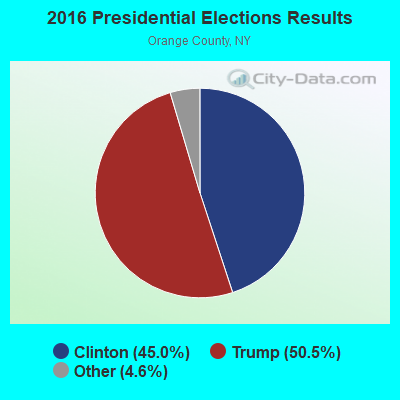
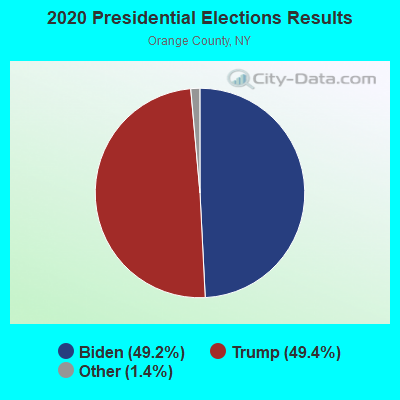
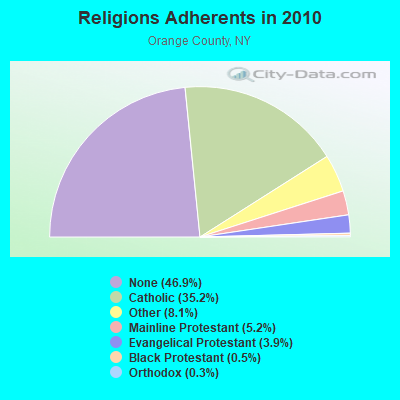
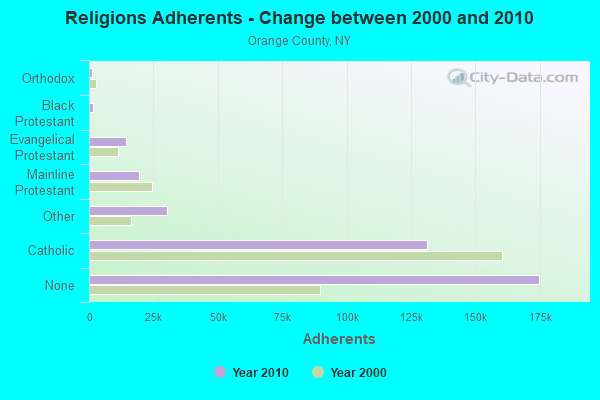
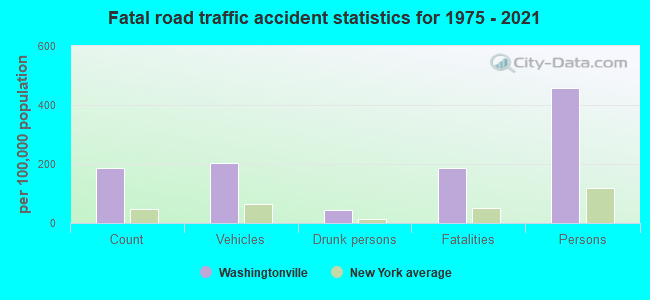
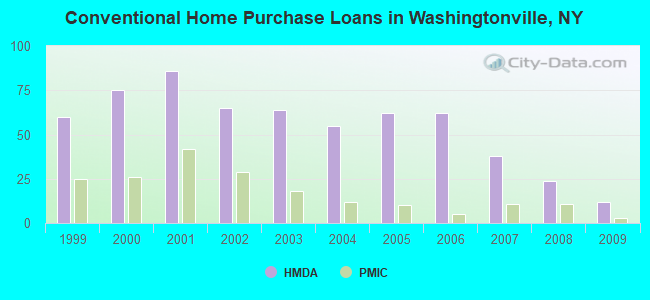
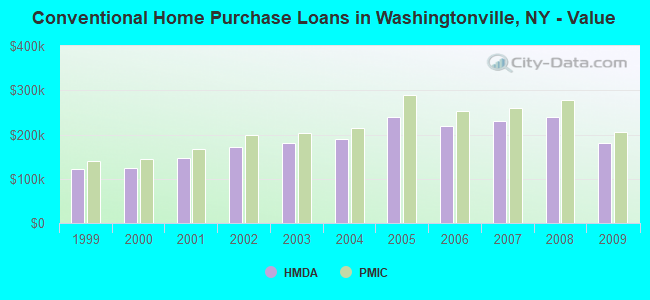
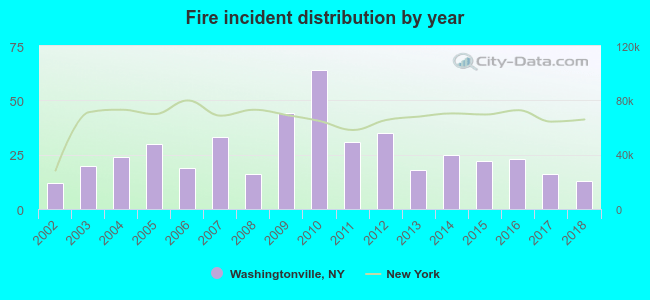 Based on the data from the years 2002 - 2018 the average number of fire incidents per year is 26. The highest number of fires - 64 took place in 2010, and the least - 12 in 2002. The data has a rising trend.
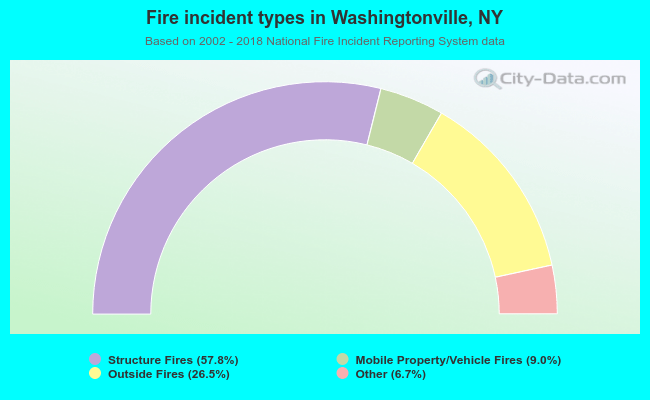 When looking into fire subcategories, the most reports belonged to: Structure Fires (57.8%), and Outside Fires (26.5%).