Crime rate in Cedar Rapids, Iowa (IA): murders, rapes, robberies, assaults, burglaries, thefts, auto thefts, arson, law enforcement employees, police officers, crime map
Crime rate in Cedar Rapids, IA
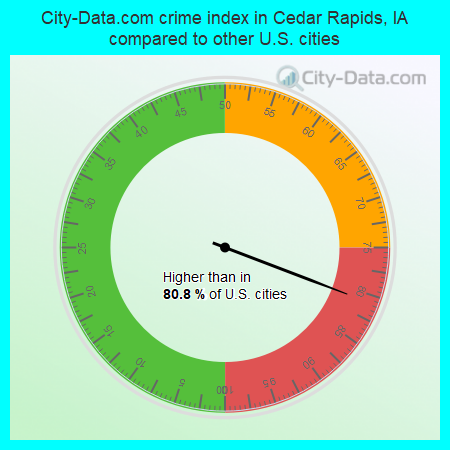
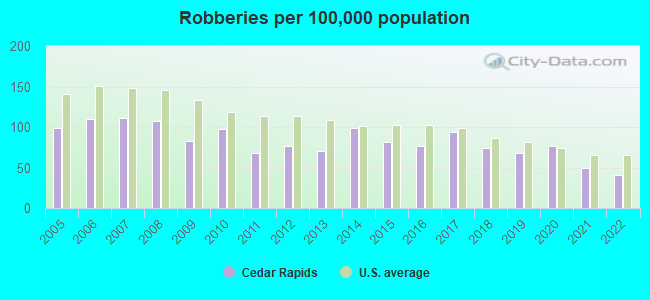
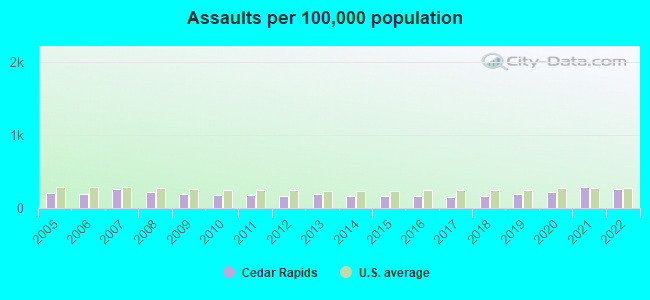
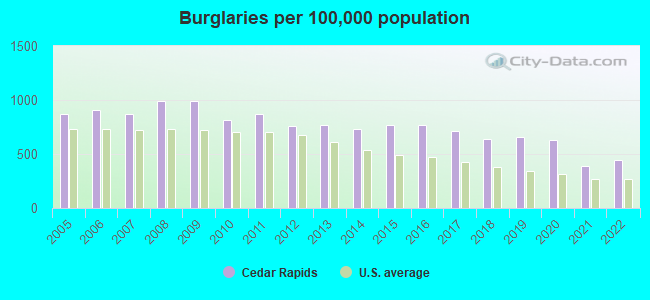
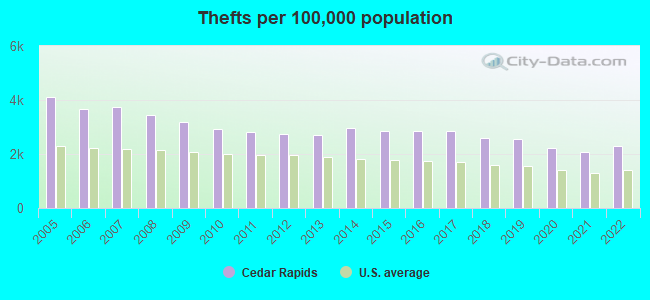
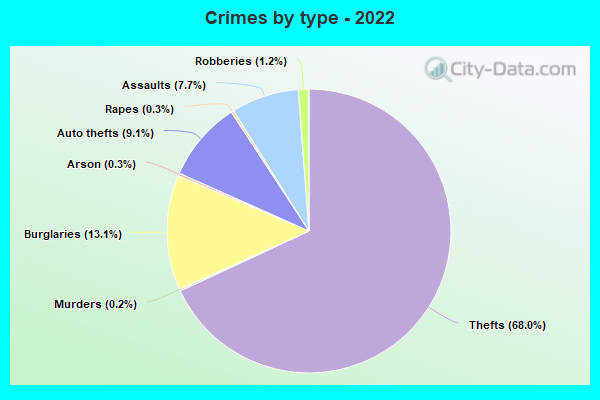
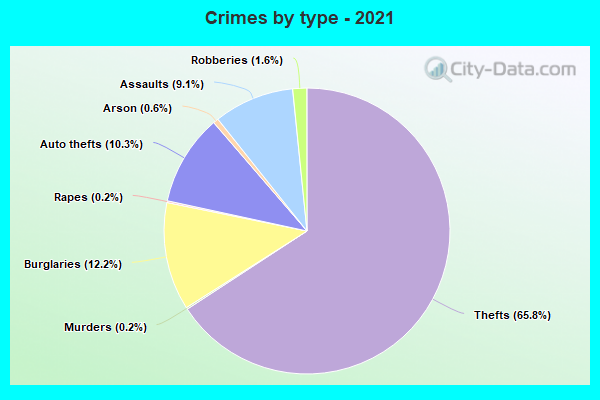
The 2022 crime rate in Cedar Rapids, IA is 235 (City-Data.com crime index), which is comparable to the U.S. average. It was higher than in 80.8% U.S. cities. The 2022 Cedar Rapids crime rate rose by 3% compared to 2021. The number of homicides stood at 10. In the last 5 years Cedar Rapids has seen rise of violent crime and decline of property crime.See how dangerous Cedar Rapids, IA is compared to the nearest cities:
(Note: Higher means more crime)
(Note: Higher means more crime)
| Cedar Rapids: | 235.0 |
| Hiawatha: | 186.4 |
| Marion: | 129.7 |
| Mount Vernon: | 185.8 |
| North Liberty: | 46.2 |
| Coralville: | 235.9 |
| Anamosa: | 94.4 |
| Vinton: | 2.2 |
| Iowa City: | 158.7 |

The City-Data.com crime index weighs serious crimes and violent crimes more heavily. Higher means more crime, U.S. average is 246.1. It adjusts for the number of visitors and daily workers commuting into cities.
- means the value is smaller than the state average.- means the value is about the same as the state average.
- means the value is bigger than the state average.
- means the value is much bigger than the state average.
According to our research of Iowa and other state lists, there were 307 registered sex offenders living in Cedar Rapids, Iowa as of May 14, 2024.
The ratio of all residents to sex offenders in Cedar Rapids is 426 to 1.
The ratio of registered sex offenders to all residents in this city is near the state average.
Violent crime rate in 2022
| Cedar Rapids: | 176.2 |
| U.S. Average: | 219.8 |
Violent crime rate in 2021
| Cedar Rapids: | 189.6 |
| U.S. Average: | 224.8 |
Violent crime rate in 2020
| Cedar Rapids: | 179.8 |
| U.S. Average: | 228.2 |
Violent crime rate in 2019
| Cedar Rapids: | 166.0 |
| U.S. Average: | 219.9 |
Violent crime rate in 2018
| Cedar Rapids: | 150.0 |
| U.S. Average: | 221.2 |
Violent crime rate in 2017
| Cedar Rapids: | 163.8 |
| U.S. Average: | 226.2 |
Violent crime rate in 2016
| Cedar Rapids: | 179.5 |
| U.S. Average: | 227.3 |
Violent crime rate in 2015
| Cedar Rapids: | 160.9 |
| U.S. Average: | 219.3 |
Violent crime rate in 2014
| Cedar Rapids: | 176.5 |
| U.S. Average: | 211.1 |
Violent crime rate in 2013
| Cedar Rapids: | 176.1 |
| U.S. Average: | 214.2 |
Violent crime rate in 2012
| Cedar Rapids: | 158.9 |
| U.S. Average: | 187.4 |
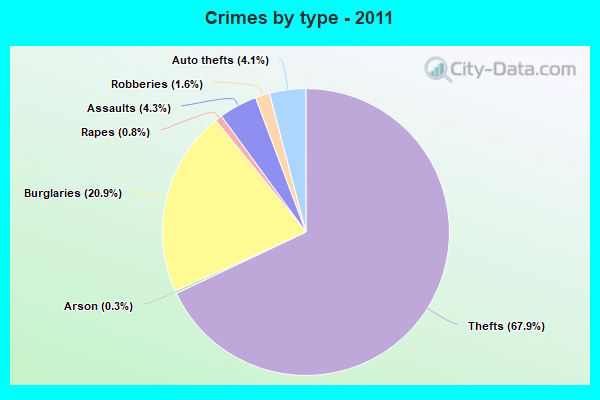
Violent crime rate in 2011
| Cedar Rapids: | 161.0 |
| U.S. Average: | 187.1 |
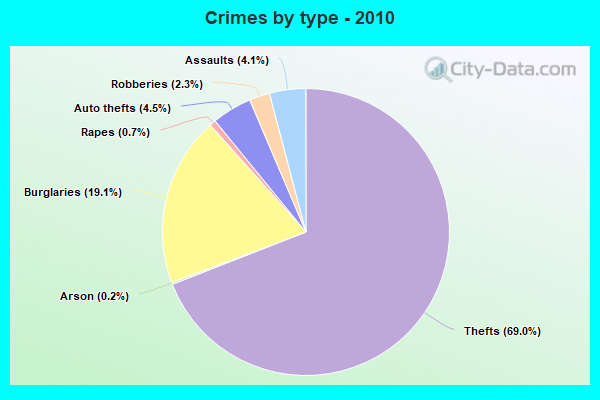
Violent crime rate in 2010
| Cedar Rapids: | 170.2 |
| U.S. Average: | 195.7 |
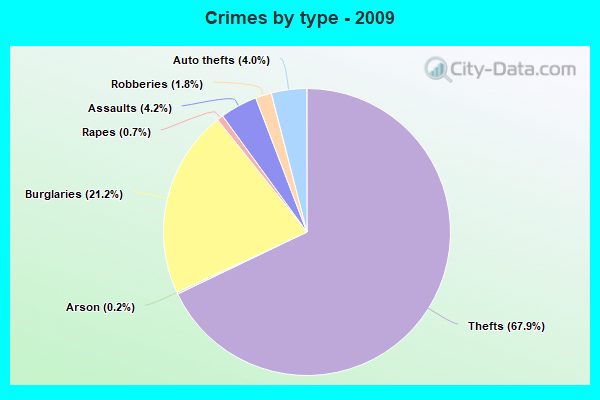
Violent crime rate in 2009
| Cedar Rapids: | 174.3 |
| U.S. Average: | 208.9 |
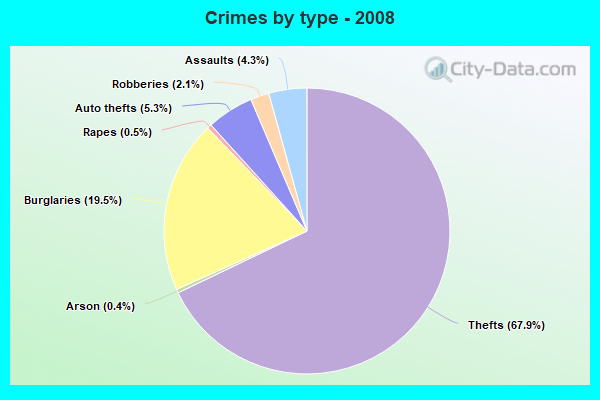
Violent crime rate in 2008
| Cedar Rapids: | 193.3 |
| U.S. Average: | 222.5 |
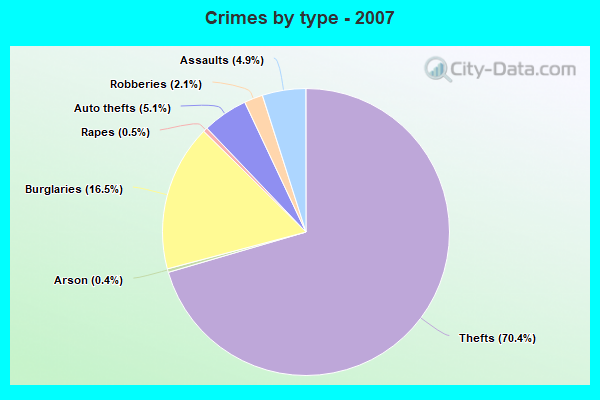
Violent crime rate in 2007
| Cedar Rapids: | 195.3 |
| U.S. Average: | 229.1 |
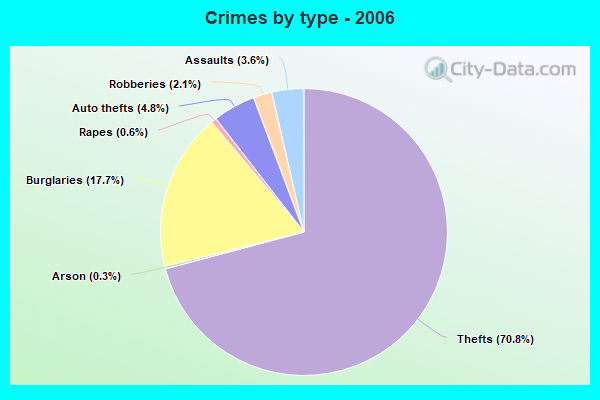
Violent crime rate in 2006
| Cedar Rapids: | 168.6 |
| U.S. Average: | 232.6 |
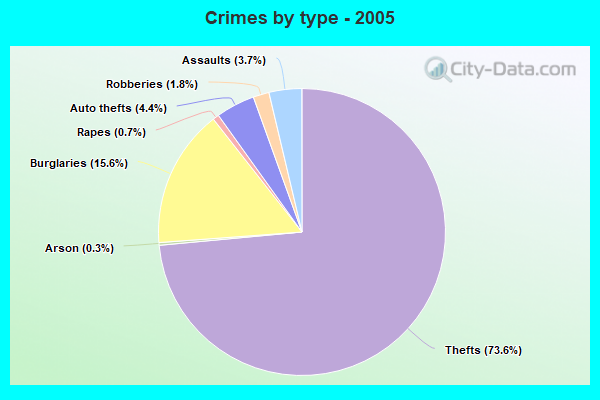
Violent crime rate in 2005
| Cedar Rapids: | 168.6 |
| U.S. Average: | 227.0 |
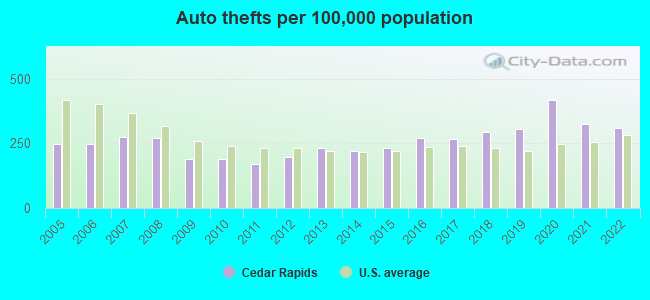
Property crime rate in 2022
| Cedar Rapids: | 249.5 |
| U.S. Average: | 166.5 |
Property crime rate in 2021
| Cedar Rapids: | 229.5 |
| U.S. Average: | 157.8 |
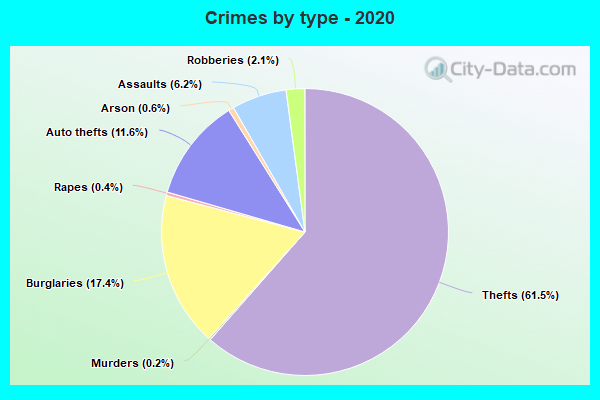
Property crime rate in 2020
| Cedar Rapids: | 298.7 |
| U.S. Average: | 169.6 |
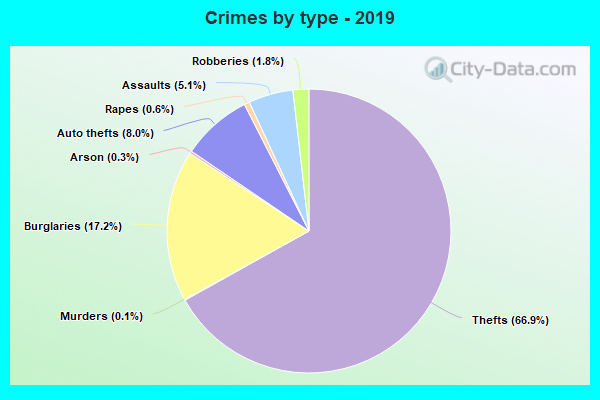
Property crime rate in 2019
| Cedar Rapids: | 305.3 |
| U.S. Average: | 179.7 |
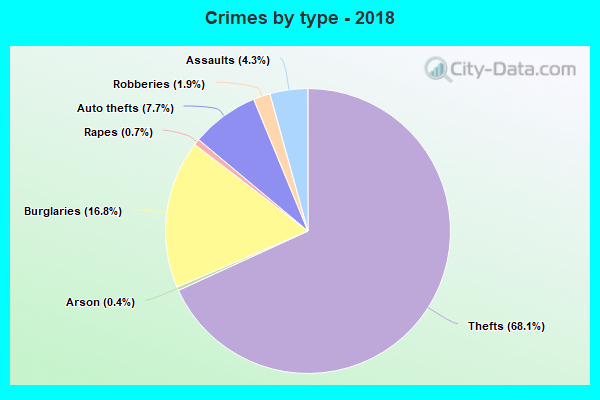
Property crime rate in 2018
| Cedar Rapids: | 302.6 |
| U.S. Average: | 190.2 |
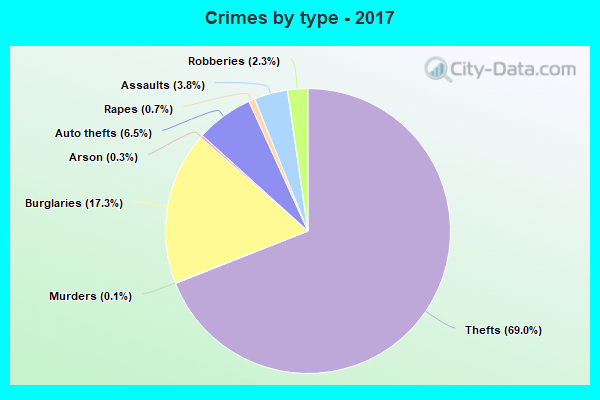
Property crime rate in 2017
| Cedar Rapids: | 324.7 |
| U.S. Average: | 206.4 |
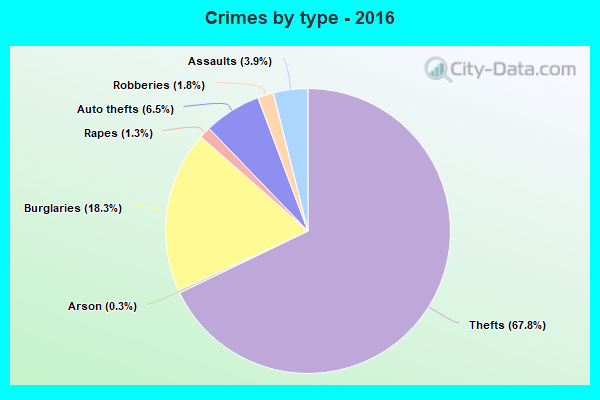
Property crime rate in 2016
| Cedar Rapids: | 336.7 |
| U.S. Average: | 216.6 |
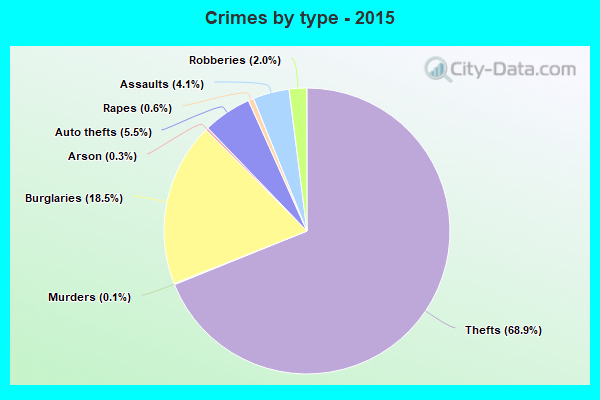
Property crime rate in 2015
| Cedar Rapids: | 331.7 |
| U.S. Average: | 221.5 |
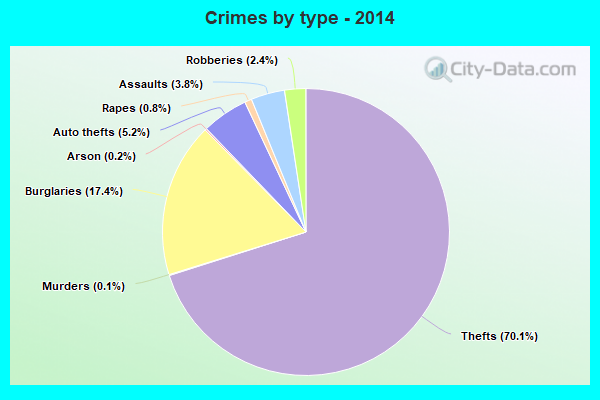
Property crime rate in 2014
| Cedar Rapids: | 327.7 |
| U.S. Average: | 230.8 |
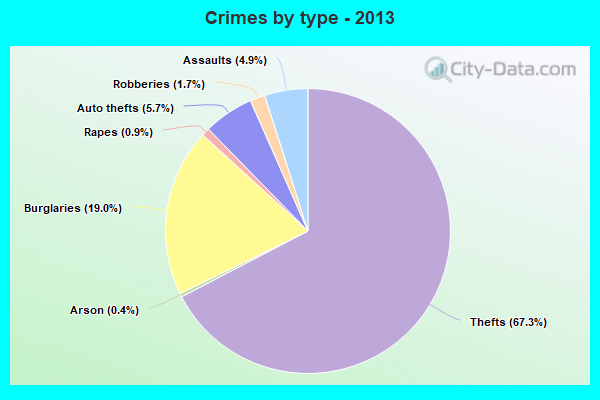
Property crime rate in 2013
| Cedar Rapids: | 323.4 |
| U.S. Average: | 250.4 |
Property crime rate in 2012
| Cedar Rapids: | 318.2 |
| U.S. Average: | 267.3 |
Property crime rate in 2011
| Cedar Rapids: | 340.7 |
| U.S. Average: | 273.5 |
Property crime rate in 2010
| Cedar Rapids: | 338.4 |
| U.S. Average: | 276.4 |
Property crime rate in 2009
| Cedar Rapids: | 386.0 |
| U.S. Average: | 285.6 |
Property crime rate in 2008
| Cedar Rapids: | 411.0 |
| U.S. Average: | 302.2 |
Property crime rate in 2007
| Cedar Rapids: | 356.8 |
| U.S. Average: | 309.2 |
Property crime rate in 2006
| Cedar Rapids: | 356.3 |
| U.S. Average: | 317.3 |
Property crime rate in 2005
| Cedar Rapids: | 370.2 |
| U.S. Average: | 322.3 |
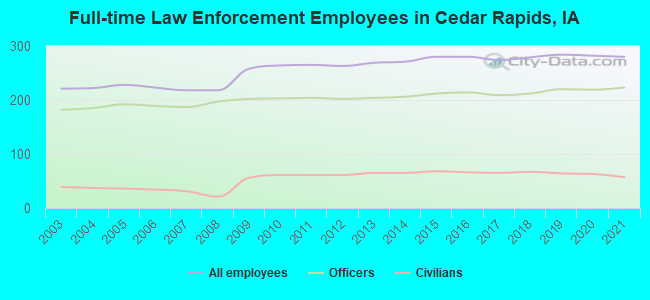
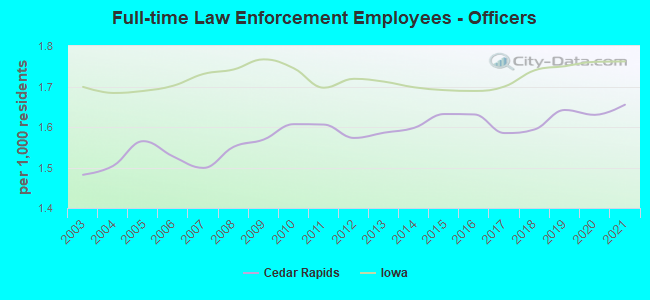
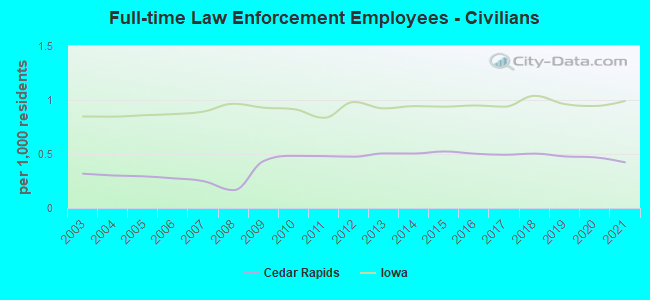
Full-time law enforcement employees in 2021, including police officers: 280 (223 officers - 187 male; 36 female).
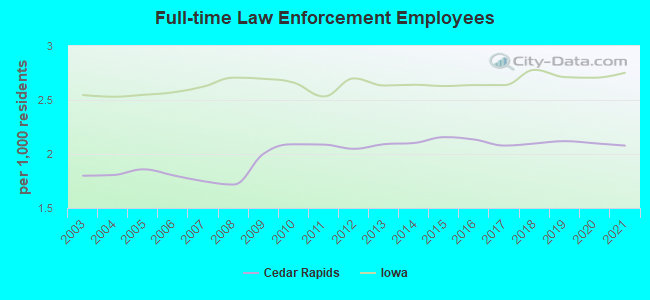
| Officers per 1,000 residents here: | 1.65 |
| Iowa average: | 1.76 |
Full-time law enforcement employees in 2020, including police officers: 282 (219 officers - 182 male; 37 female).
| Officers per 1,000 residents here: | 1.63 |
| Iowa average: | 1.76 |
Full-time law enforcement employees in 2019, including police officers: 284 (220 officers - 185 male; 35 female).
| Officers per 1,000 residents here: | 1.64 |
| Iowa average: | 1.75 |
Full-time law enforcement employees in 2018, including police officers: 279 (212 officers - 179 male; 33 female).
| Officers per 1,000 residents here: | 1.59 |
| Iowa average: | 1.74 |
Full-time law enforcement employees in 2017, including police officers: 274 (209 officers - 178 male; 31 female).
| Officers per 1,000 residents here: | 1.58 |
| Iowa average: | 1.70 |
Full-time law enforcement employees in 2016, including police officers: 280 (214 officers - 182 male; 32 female).
| Officers per 1,000 residents here: | 1.63 |
| Iowa average: | 1.69 |
Full-time law enforcement employees in 2015, including police officers: 280 (212 officers - 179 male; 33 female).
| Officers per 1,000 residents here: | 1.63 |
| Iowa average: | 1.69 |
Full-time law enforcement employees in 2014, including police officers: 271 (206 officers - 175 male; 31 female).
| Officers per 1,000 residents here: | 1.60 |
| Iowa average: | 1.70 |
Full-time law enforcement employees in 2013, including police officers: 269 (204 officers - 173 male; 31 female).
| Officers per 1,000 residents here: | 1.59 |
| Iowa average: | 1.71 |
Full-time law enforcement employees in 2012, including police officers: 263 (202 officers - 172 male; 30 female).
| Officers per 1,000 residents here: | 1.57 |
| Iowa average: | 1.72 |
Full-time law enforcement employees in 2011, including police officers: 265 (204 officers - 172 male; 32 female).
| Officers per 1,000 residents here: | 1.61 |
| Iowa average: | 1.70 |
Full-time law enforcement employees in 2010, including police officers: 264 (203 officers - 173 male; 30 female).
| Officers per 1,000 residents here: | 1.61 |
| Iowa average: | 1.75 |
Full-time law enforcement employees in 2009, including police officers: 258 (202 officers - 172 male; 30 female).
| Officers per 1,000 residents here: | 1.57 |
| Iowa average: | 1.77 |
Full-time law enforcement employees in 2008, including police officers: 218 (197 officers - 170 male; 27 female).
| Officers per 1,000 residents here: | 1.55 |
| Iowa average: | 1.74 |
Full-time law enforcement employees in 2007, including police officers: 218 (187 officers - 163 male; 24 female).
| Officers per 1,000 residents here: | 1.50 |
| Iowa average: | 1.73 |
Full-time law enforcement employees in 2006, including police officers: 223 (189 officers - 167 male; 22 female).
| Officers per 1,000 residents here: | 1.53 |
| Iowa average: | 1.70 |
Full-time law enforcement employees in 2005, including police officers: 228 (192 officers - 170 male; 22 female).
| Officers per 1,000 residents here: | 1.56 |
| Iowa average: | 1.69 |
Full-time law enforcement employees in 2004, including police officers: 222 (185 officers - 165 male; 20 female).
| Officers per 1,000 residents here: | 1.50 |
| Iowa average: | 1.68 |
Full-time law enforcement employees in 2003, including police officers: 221 (182 officers - 161 male; 21 female).
| Officers per 1,000 residents here: | 1.48 |
| Iowa average: | 1.70 |

Zip codes: 52227, 52228, 52233, 52302, 52324, 52328, 52338, 52401, 52402, 52404, 52405, 52411.