Tallmadge: Fire Incidents, Ohio (OH)
Where are fire incidents reported in Tallmadge, OH
Something went wrong! Please refresh the page.
| Fire incidents reported | |
|---|---|
| Sreet name | Count |
| THOMAS RD | 146 |
| WEST AVE | 116 |
| SOUTHEAST AVE | 106 |
| SOUTH AVE | 96 |
| NORTHEAST AVE | 84 |
| EAST AVE | 66 |
| NORTH AVE | 66 |
| HOWE RD | 54 |
| MUNROE RD | 46 |
| NORTHWEST AVE | 46 |
| NEWTON ST | 38 |
| BRITTAIN CIR | 34 |
| EASTWOOD AVE | 24 |
| OVERDALE DR | 24 |
| PERRY RD | 18 |
| EASTWOOD RD | 16 |
| MIDWAY PLZ | 16 |
| PARKER LN | 16 |
| SOUTHWEST AVE | 16 |
| TALLMADGE CIR | 16 |
| TREAT BLVD | 16 |
| VAN EVERA RD | 16 |
| WASHBURN RD | 16 |
| FENN RD | 14 |
| GARWOOD DR | 14 |
| I-76 - 28 MM | 14 |
| DUNBAR RD | 12 |
| I-76 | 12 |
| INTERSTATE 76 HWY | 12 |
| JUNE DR | 12 |
2002 - 2018 National Fire Incident Reporting System (NFIRS) incidents
- Incident types reported to NFIRS in Tallmadge, OH
- 10,10163.5%Rescue & EMS
- 2,49015.7%Service Call
- 9305.8%Fire
- 8735.5%False Alarm
- 8375.3%Hazardous Condition
- 6183.9%Good Intent Call
- 330.2%Special Incident
- 180.1%Overpressure Rupture
- Fire incident types reported to NFIRS in Tallmadge, OH
- 48552.2%Structure Fires
- 25827.7%Outside Fires
- 18319.7%Mobile Property/Vehicle Fires
- 40.4%Other
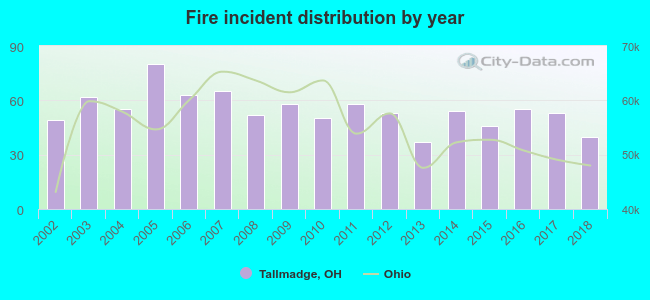 According to the data from the years 2002 - 2018 the average number of fire incidents per year is 55. The highest number of reported fire incidents - 80 took place in 2005, and the least - 37 in 2013. The data has a dropping trend.
The average number of yearly fire incidents per 10k residents in Tallmadge, OH compared to nearest cities:
(Note: Based on data for the last 3 years, including only cities with population 5,000 and above)
| Tallmadge: | 28.1 |
| Munroe Falls: | 12.6 |
| Kent: | 26.5 |
| Cuyahoga Falls: | 24.9 |
| Akron: | 43.8 |
| Stow: | 18.6 |
| Green: | 0.6 |
| Hudson: | 12.2 |
| Ravenna: | 117.4 |
 The median response time based on all reported fire incidents is 5 minutes. This is lower than the state median value.
The median response time in Tallmadge, OH compared to nearest cities:
(Note: Based on data for all years, including only cities with at least 500 fire incidents)
| Tallmadge: | 5 minutes |
| Mogadore: | 6 minutes |
| Brimfield: | 6 minutes |
| Kent: | 6 minutes |
| Cuyahoga Falls: | 4 minutes |
| Akron: | 5 minutes |
| Stow: | 5 minutes |
| Uniontown: | 5 minutes |
| Hudson: | 6 minutes |
 Based on the data from the years 2002 - 2018 the average number of fire-related yearly casualties is 1. The highest number of reported injuries - 3 took place in 2005, and the lowest - 0 in 2002. The data has a rising trend.
The average number of injuries per 1,000 fire incidents is 24. This indicator was the highest - 58 in 2008, and the lowest 0 in 2002. The trend for injuries per 1,000 fires is growing. Compared to the state value the number of injuries per 1,000 incidents is higher.
Based on the data from the years 2002 - 2018 the average number of fire-related yearly casualties is 1. The highest number of reported injuries - 3 took place in 2005, and the lowest - 0 in 2002. The data has a rising trend.
The average number of injuries per 1,000 fire incidents is 24. This indicator was the highest - 58 in 2008, and the lowest 0 in 2002. The trend for injuries per 1,000 fires is growing. Compared to the state value the number of injuries per 1,000 incidents is higher.
 28.9% incidents where reported in the morning and 71.1% in the evening. The most fires (18.0%) took place on Saturday, and the least (11.7%) on Friday.
 Based on the 930 fire incidents from years 2002 - 2018 most fires (11.4%) took place during April, and the least (5.8%) in February.
 Out of all 15,908 cases reported during the years 2002 - 2018, the most belonged to the categories: Rescue & EMS (63.5%), Service Call (15.7%), and Fire (5.8%).
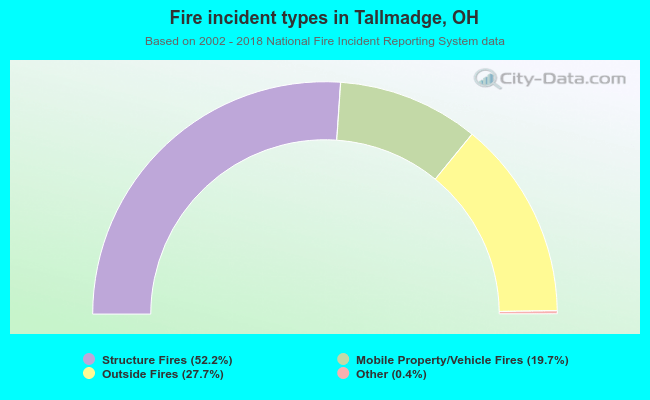 When looking into fire subcategories, the most incidents belonged to: Structure Fires (52.2%), and Outside Fires (27.7%).