Algonquin: Fire Incidents, Illinois (IL)
Where are fire incidents reported in Algonquin, IL
Something went wrong! Please refresh the page.
| Fire incidents reported | |
|---|---|
| Sreet name | Count |
| RANDALL RD | 234 |
| ALGONQUIN RD | 176 |
| MAIN ST | 54 |
| BUNKER HILL DR | 52 |
| HARRISON ST | 32 |
| ALGONQUIN RD | 26 |
| GLENWOOD CT | 24 |
| HUBBARD ST | 24 |
| LONGWOOD DR | 24 |
| RANDALL RD | 24 |
| GASLIGHT DR | 18 |
| HARNISH DR | 18 |
| HELEN DR | 18 |
| WASHINGTON ST | 18 |
| HAEGERS BEND RD | 16 |
| RIVER RD | 16 |
| GRANDVIEW CT | 14 |
| COUNTY LINE RD | 12 |
| HAEGERS BEND | 12 |
| MERCHANT DR | 12 |
| SLEEPY HOLLOW RD | 12 |
| TIMBERWOOD LN | 12 |
| ARROWHEAD DR | 10 |
| CIRCLE DR | 10 |
| COMPTON DR | 10 |
| DAWSON LN | 10 |
| EDGEWOOD DR | 10 |
| OCEOLA DR | 10 |
| ROUTE 31 | 10 |
| VISTA DR | 10 |
| Other | 239 |
2002 - 2018 National Fire Incident Reporting System (NFIRS) incidents
- Incident types reported to NFIRS in Algonquin, IL
- 10,54656.3%Rescue & EMS
- 3,21817.2%False Alarm
- 1,6348.7%Hazardous Condition
- 1,3077.0%Service Call
- 1,1676.2%Fire
- 8184.4%Good Intent Call
- 200.1%Overpressure Rupture
- Fire incident types reported to NFIRS in Algonquin, IL
- 59450.9%Structure Fires
- 43437.2%Outside Fires
- 12310.5%Mobile Property/Vehicle Fires
- 161.4%Other
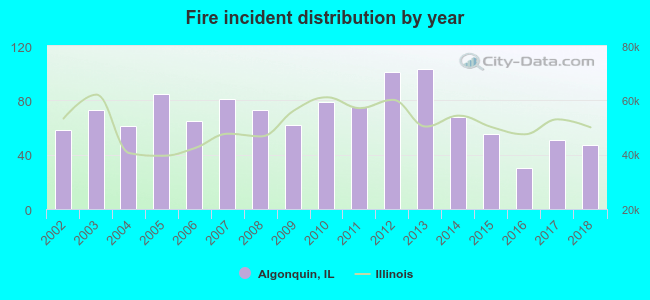 Based on the data from the years 2002 - 2018 the average number of fires per year is 69. The highest number of fire incidents - 103 took place in 2013, and the least - 30 in 2016. The data has a declining trend.
The average number of yearly fire incidents per 10k residents in Algonquin, IL compared to nearest cities:
(Note: Based on data for the last 3 years, including only cities with population 5,000 and above)
| Algonquin: | 14.0 |
| Lake in the Hills: | 10.8 |
| Carpentersville: | 23.7 |
| Cary: | 25.9 |
| Crystal Lake: | 24.9 |
| West Dundee: | 40.1 |
| Gilberts: | 22.5 |
| Huntley: | 21.0 |
| Elgin: | 28.3 |
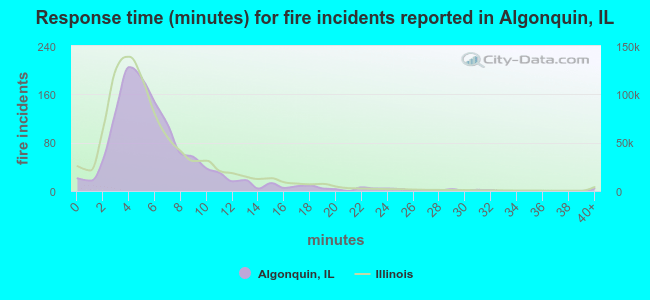 The median response time based on all reported fire incidents is 5 minutes. This is similar to the state median value.
The median response time in Algonquin, IL compared to nearest cities:
(Note: Based on data for all years, including only cities with at least 500 fire incidents)
| Algonquin: | 5 minutes |
| Lake in the Hills: | 5 minutes |
| Carpentersville: | 5 minutes |
| Cary: | 5 minutes |
| Crystal Lake: | 6 minutes |
| Huntley: | 7 minutes |
| Elgin: | 4 minutes |
| Barrington: | 7 minutes |
| Wauconda: | 6 minutes |
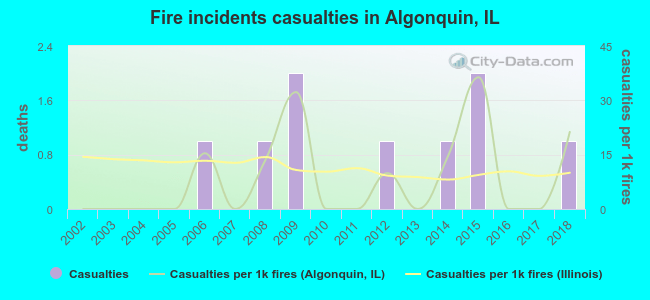 Based on the reports from the years 2002 - 2018 the average number of fire-related casualties per year is 1. The highest number of injuries - 2 took place in 2009, and the lowest - 0 in 2002. The data has a rising trend.
The average number of injuries per 1,000 fires is 8. This indicator was the highest - 36 in 2015, and the lowest 0 in 2002. The trend for casualties per 1,000 fire incidents is growing. Compared to the Illinois value the number of injuries per 1,000 incidents is lower.
Based on the reports from the years 2002 - 2018 the average number of fire-related casualties per year is 1. The highest number of injuries - 2 took place in 2009, and the lowest - 0 in 2002. The data has a rising trend.
The average number of injuries per 1,000 fires is 8. This indicator was the highest - 36 in 2015, and the lowest 0 in 2002. The trend for casualties per 1,000 fire incidents is growing. Compared to the Illinois value the number of injuries per 1,000 incidents is lower.Casualties per 1,000 incidents in Algonquin, IL compared to nearest cities:
(Note: Based on data for all years, including only cities with at least 500 fire incidents)
| Algonquin: | 7.7 |
| Lake in the Hills: | 6.1 |
| Carpentersville: | 13.6 |
| Cary: | 1.4 |
| Crystal Lake: | 9.7 |
| Huntley: | 1.9 |
| Elgin: | 25.6 |
| Barrington: | 5.8 |
| Wauconda: | 7.1 |
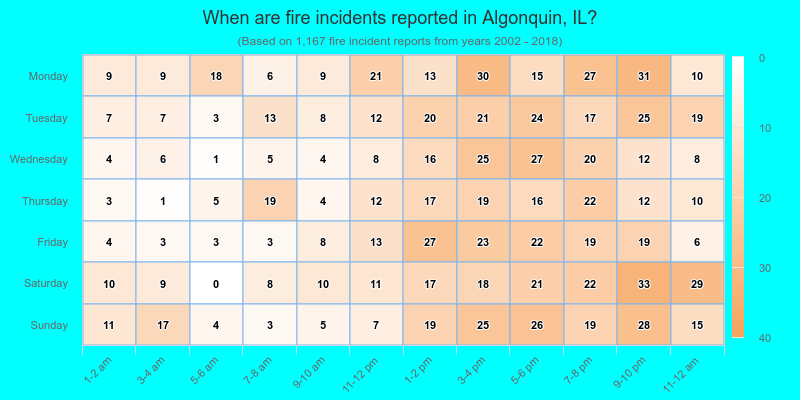
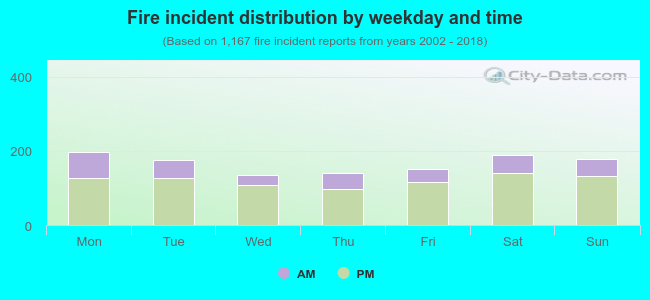 27.7% incidents where reported in the morning and 72.3% in the evening. The most fires (17.0%) took place on Monday, and the least (11.7%) on Wednesday.
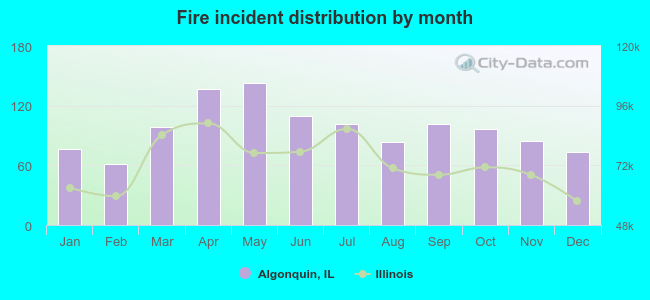 Based on the 1,167 fires from years 2002 - 2018 most fires (12.3%) took place during May, and the least (5.2%) in February.
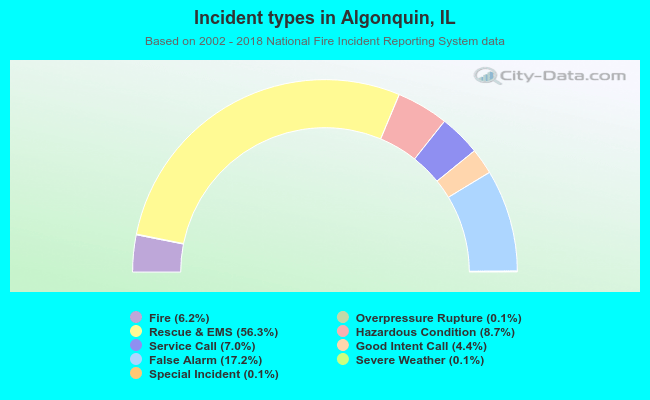 Out of all 18,734 cases reported during the years 2002 - 2018, the most belonged to the categories: Rescue & EMS (56.3%), False Alarm (17.2%), and Hazardous Condition (8.7%).
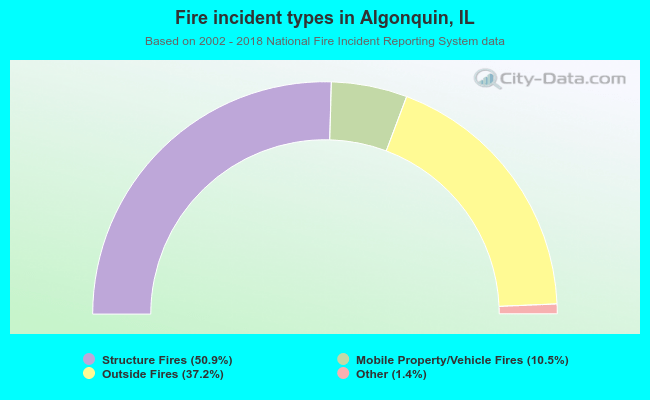 When looking into fire subcategories, the most incidents belonged to: Structure Fires (50.9%), and Outside Fires (37.2%).