Lake in the Hills: Fire Incidents, Illinois (IL)
Where are fire incidents reported in Lake in the Hills, IL
Something went wrong! Please refresh the page.
| Fire incidents reported | |
|---|---|
| Sreet name | Count |
| RANDALL RD | 82 |
| ALGONQUIN RD | 50 |
| CUNAT CT | 44 |
| PYOTT RD | 38 |
| ACORN LN | 32 |
| OAK ST | 24 |
| COUNCIL TRL | 18 |
| MILLER RD | 18 |
| ANNANDALE DR | 16 |
| HARVEST GATE | 16 |
| LAKEWOOD RD | 16 |
| POLARIS DR | 16 |
| CRYSTAL LAKE RD | 14 |
| HILLTOP DR | 14 |
| MELBOURNE LN | 14 |
| HALIGUS RD | 12 |
| HEAVENS GATE | 12 |
| PARC CT | 12 |
| BARHARBOR DR | 10 |
| BRISBANE DR | 10 |
| RANDALL RD | 10 |
| SEMINOLE TRL | 10 |
| STARWOOD PASS | 10 |
| WILLOW ST | 10 |
| ADAMS ST | 8 |
| CASTLE PINES CT | 8 |
| CLAREMONT LN | 8 |
| HAWTHORNE RD | 8 |
| HERON DR | 8 |
| INDUSTRIAL DR | 8 |
| Other | 98 |
2002 - 2018 National Fire Incident Reporting System (NFIRS) incidents
- Incident types reported to NFIRS in Lake in the Hills, IL
- 6,42056.8%Rescue & EMS
- 1,76915.7%False Alarm
- 1,14310.1%Hazardous Condition
- 8717.7%Service Call
- 6545.8%Fire
- 4243.8%Good Intent Call
- 120.1%Overpressure Rupture
- Fire incident types reported to NFIRS in Lake in the Hills, IL
- 32850.2%Structure Fires
- 24637.6%Outside Fires
- 6610.1%Mobile Property/Vehicle Fires
- 142.1%Other
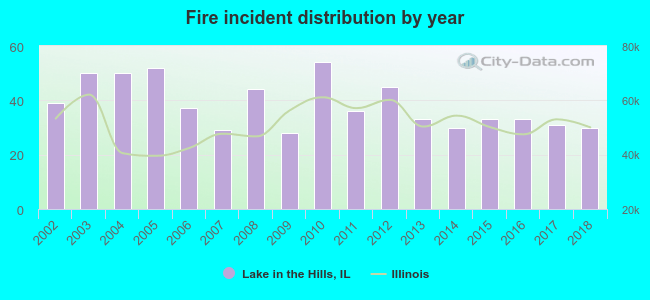 Based on the data from the years 2002 - 2018 the average number of fire incidents per year is 38. The highest number of reported fire incidents - 54 took place in 2010, and the least - 28 in 2009. The data has a declining trend.
The average number of yearly fire incidents per 10k residents in Lake in the Hills, IL compared to nearest cities:
(Note: Based on data for the last 3 years, including only cities with population 5,000 and above)
| Lake in the Hills: | 10.8 |
| Crystal Lake: | 24.9 |
| Algonquin: | 14.0 |
| Huntley: | 21.0 |
| Cary: | 25.9 |
| Carpentersville: | 23.7 |
| Gilberts: | 22.5 |
| West Dundee: | 40.1 |
| Pingree Grove: | 36.9 |
 The median response time based on all reported fire incidents is 5 minutes. This is about the same as the state median value.
The median response time in Lake in the Hills, IL compared to nearest cities:
(Note: Based on data for all years, including only cities with at least 500 fire incidents)
| Lake in the Hills: | 5 minutes |
| Crystal Lake: | 6 minutes |
| Algonquin: | 5 minutes |
| Huntley: | 7 minutes |
| Cary: | 5 minutes |
| Carpentersville: | 5 minutes |
| Woodstock: | 6 minutes |
| Elgin: | 4 minutes |
| Hampshire: | 9 minutes |
 Based on the data from the years 2002 - 2018 the average number of fire-related casualties per year is 0. The highest number of reported casualties - 2 took place in 2014, and the lowest - 0 in 2002. The data has a constant trend.
The average number of injuries per 1,000 fire incidents is 7. This indicator was the highest - 67 in 2014, and the lowest 0 in 2002. The trend for injuries per 1,000 fire incidents is constant. Compared to the Illinois value the number of casualties per 1,000 fires is lower.
Based on the data from the years 2002 - 2018 the average number of fire-related casualties per year is 0. The highest number of reported casualties - 2 took place in 2014, and the lowest - 0 in 2002. The data has a constant trend.
The average number of injuries per 1,000 fire incidents is 7. This indicator was the highest - 67 in 2014, and the lowest 0 in 2002. The trend for injuries per 1,000 fire incidents is constant. Compared to the Illinois value the number of casualties per 1,000 fires is lower.Casualties per 1,000 incidents in Lake in the Hills, IL compared to nearest cities:
(Note: Based on data for all years, including only cities with at least 500 fire incidents)
| Lake in the Hills: | 6.1 |
| Crystal Lake: | 9.7 |
| Algonquin: | 7.7 |
| Huntley: | 1.9 |
| Cary: | 1.4 |
| Carpentersville: | 13.6 |
| Woodstock: | 12.7 |
| Elgin: | 25.6 |
| Hampshire: | 6.7 |
 26.3% incidents where reported in the morning and 73.7% in the evening. The most fires (16.5%) took place on Sunday, and the least (11.8%) on Friday.
 Based on the 654 fires from years 2002 - 2018 most fires (15.6%) took place during July, and the least (3.7%) in January.
 Out of all 11,300 cases reported during the years 2002 - 2018, the most belonged to the categories: Rescue & EMS (56.8%), False Alarm (15.7%), and Hazardous Condition (10.1%).
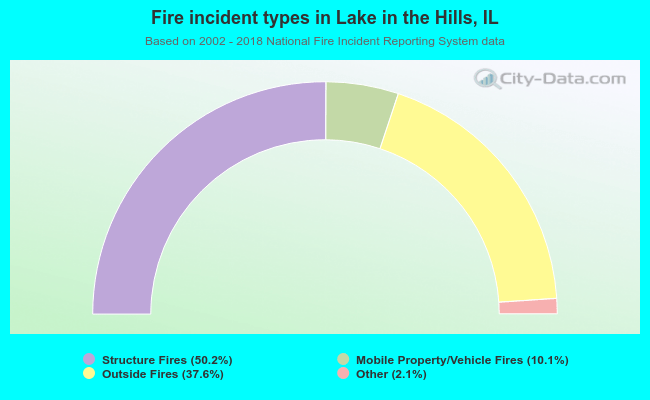 When looking into fire subcategories, the most incidents belonged to: Structure Fires (50.2%), and Outside Fires (37.6%).