Wyandanch: Fire Incidents, New York (NY)
Where are fire incidents reported in Wyandanch, NY
Something went wrong! Please refresh the page.
|
| |||||||||||||||||||||||||||||||||||||||||||||||||||||||||||||||||||||||||||||||||||||||||||||||||||||||||||||
2004 - 2018 National Fire Incident Reporting System (NFIRS) incidents
- Incident types reported to NFIRS in Wyandanch, NY
- 98134.8%Hazardous Condition
- 58720.8%Fire
- 55019.5%False Alarm
- 2689.5%Rescue & EMS
- 2428.6%Good Intent Call
- 1655.9%Service Call
- 170.6%Special Incident
- 60.2%Overpressure Rupture
- 30.1%Severe Weather
- Fire incident types reported to NFIRS in Wyandanch, NY
- 27146.2%Structure Fires
- 18331.2%Outside Fires
- 10217.4%Mobile Property/Vehicle Fires
- 315.3%Other
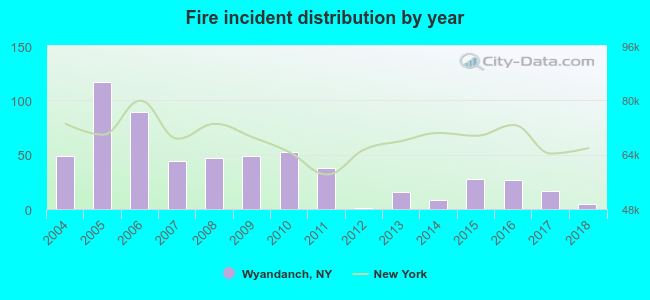 Based on the data from the years 2004 - 2018 the average number of fire incidents per year is 39. The highest number of fires - 117 took place in 2005, and the least - 1 in 2012. The data has a declining trend.
The average number of yearly fire incidents per 10k residents in Wyandanch, NY compared to nearest cities:
(Note: Based on data for the last 3 years, including only cities with population 5,000 and above)
| Wyandanch: | 14.0 |
| Wheatley Heights: | 6.8 |
| Deer Park: | 9.4 |
| West Babylon: | 0.2 |
| North Babylon: | 1.5 |
| East Farmingdale: | 7.7 |
| Melville: | 9.8 |
| Dix Hills: | 2.2 |
| North Amityville: | 1.5 |
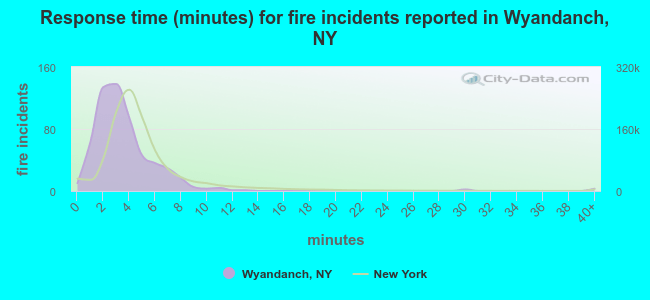 The median response time based on all reported fire incidents is 3 minutes. This is lower than the New York median value.
The median response time in Wyandanch, NY compared to nearest cities:
(Note: Based on data for all years, including only cities with at least 500 fire incidents)
| Wyandanch: | 3 minutes |
| Lindenhurst: | 3 minutes |
| West Islip: | 3 minutes |
| Copiague: | 4 minutes |
| Amityville: | 5 minutes |
| Bay Shore: | 4 minutes |
| Brentwood: | 6 minutes |
| Huntington Station: | 4 minutes |
| Massapequa: | 6 minutes |
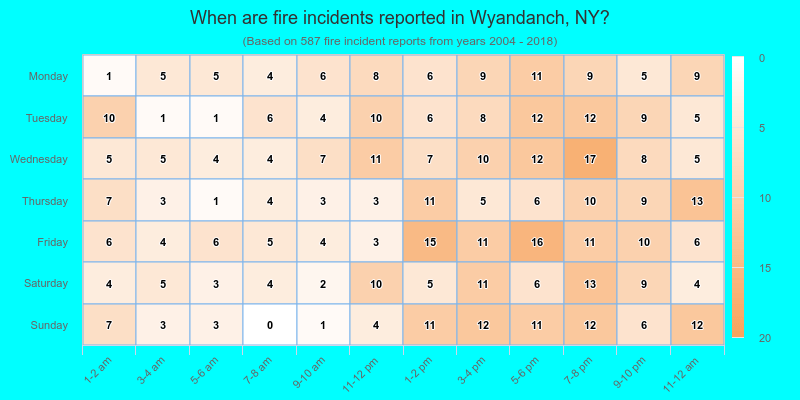
 32.7% incidents where reported in the morning and 67.3% in the evening. The most fires (16.5%) took place on Friday, and the least (12.8%) on Thursday.
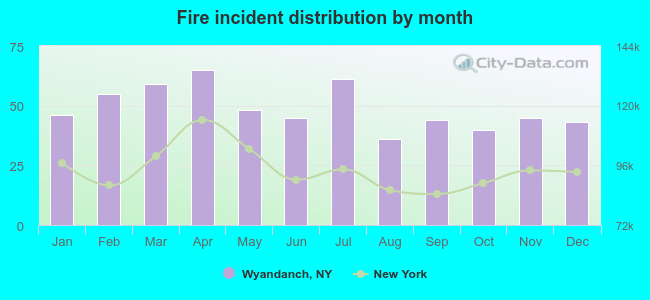 According to the 587 fire incidents from years 2004 - 2018 most fires (11.1%) took place during April, and the least (6.1%) in August.
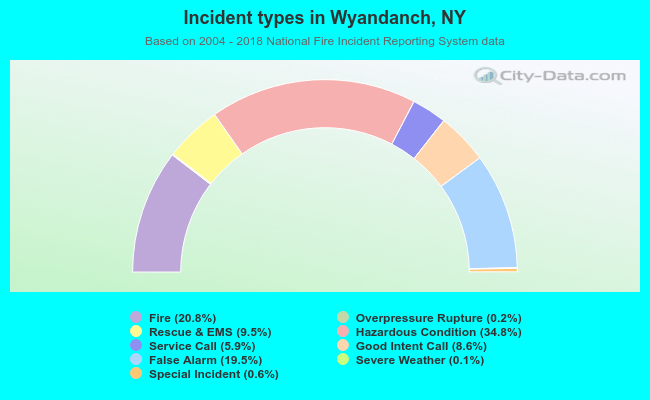 Out of all 2,819 cases reported during the years 2004 - 2018, the most belonged to the categories: Hazardous Condition (34.8%), Fire (20.8%), and False Alarm (19.5%).
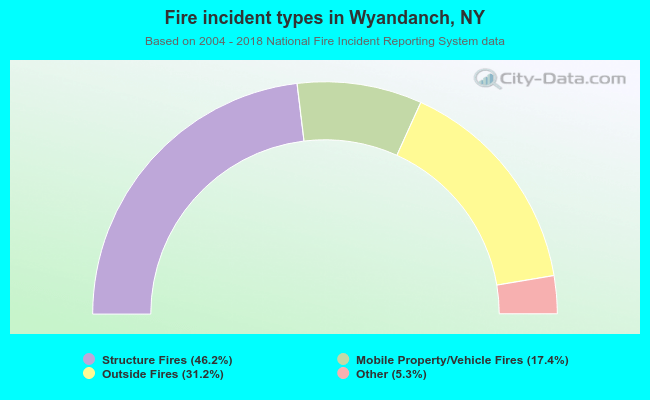 When looking into fire subcategories, the most incidents belonged to: Structure Fires (46.2%), and Outside Fires (31.2%).