Balch Springs: Fire Incidents, Texas (TX)
Where are fire incidents reported in Balch Springs, TX
Something went wrong! Please refresh the page.
| Fire incidents reported | |
|---|---|
| Sreet name | Count |
| QUAIL DR | 204 |
| LAKE JUNE RD | 144 |
| PEACHTREE RD | 132 |
| I-635 LBJ | 116 |
| PIONEER RD | 102 |
| HICKORY TREE RD | 72 |
| I20 | 70 |
| I635 | 68 |
| ELAM RD | 64 |
| I635 LBJ | 64 |
| GLENSHIRE DR | 58 |
| I-20 | 58 |
| SEAGOVILLE RD | 54 |
| BELTLINE RD | 50 |
| AMBASSADOR WAY | 46 |
| LAKESIDE RD | 46 |
| SHEPHERD LN | 46 |
| COTTONWOOD MNR | 44 |
| CRYSTAL DR | 36 |
| ELAM | 36 |
| LAKE JUNE | 30 |
| SPRING OAKS DR | 30 |
| BALCH SPRINGS RD | 26 |
| PEACHTREE | 26 |
| PEACHTREE RD | 26 |
| POST RD | 26 |
| QUAIL | 26 |
| WOODBURY RD | 26 |
| PIONEER | 24 |
| TIMOTHY LN | 24 |
2002 - 2018 National Fire Incident Reporting System (NFIRS) incidents
- Incident types reported to NFIRS in Balch Springs, TX
- 9,64868.1%Rescue & EMS
- 1,76212.4%Fire
- 1,2218.6%Hazardous Condition
- 7305.2%Good Intent Call
- 4223.0%Service Call
- 3322.3%False Alarm
- 300.2%Special Incident
- 150.1%Overpressure Rupture
- Fire incident types reported to NFIRS in Balch Springs, TX
- 86248.9%Outside Fires
- 46026.1%Structure Fires
- 38121.6%Mobile Property/Vehicle Fires
- 593.3%Other
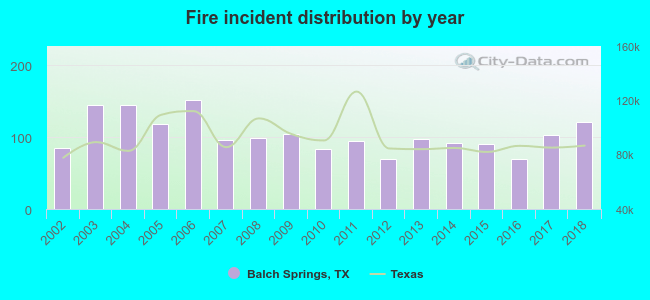 Based on the data from the years 2002 - 2018 the average number of fires per year is 104. The highest number of fire incidents - 151 took place in 2006, and the least - 69 in 2012. The data has a growing trend.
The average number of yearly fire incidents per 10k residents in Balch Springs, TX compared to nearest cities:
(Note: Based on data for the last 3 years, including only cities with population 5,000 and above)
| Balch Springs: | 39.0 |
| Mesquite: | 31.4 |
| Seagoville: | 51.3 |
| Sunnyvale: | 56.1 |
| Hutchins: | 76.1 |
| Forney: | 71.1 |
| Dallas: | 16.3 |
| Heath: | 31.3 |
| Lancaster: | 43.2 |
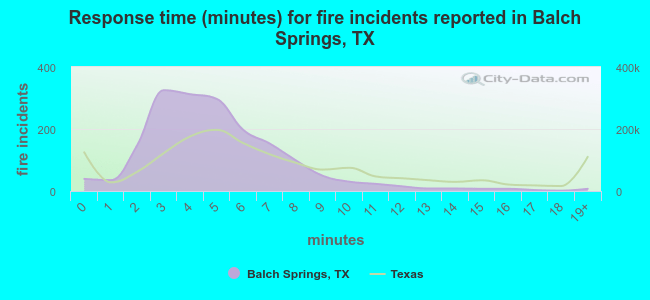 The median response time based on all reported fire incidents is 5 minutes. This is lower compared to the Texas median value.
The median response time in Balch Springs, TX compared to nearest cities:
(Note: Based on data for all years, including only cities with at least 500 fire incidents)
| Balch Springs: | 5 minutes |
| Mesquite: | 5 minutes |
| Seagoville: | 5 minutes |
| Hutchins: | 6 minutes |
| Forney: | 6 minutes |
| Wilmer: | 6 minutes |
| Crandall: | 8 minutes |
| Dallas: | 4 minutes |
| Lancaster: | 6 minutes |
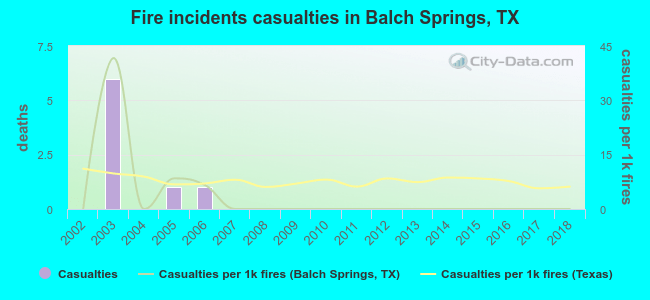 Based on the reports from the years 2002 - 2018 the average number of fire-related yearly casualties is 0. The highest number of reported injuries - 6 took place in 2003, and the lowest - 0 in 2002. The data has a constant trend.
The average number of casualties per 1,000 fire incidents is 3. This indicator was the highest - 42 in 2003, and the lowest 0 in 2002. The trend for injuries per 1,000 fires is constant. Compared to the state value the number of injuries per 1,000 incidents is lower.
Based on the reports from the years 2002 - 2018 the average number of fire-related yearly casualties is 0. The highest number of reported injuries - 6 took place in 2003, and the lowest - 0 in 2002. The data has a constant trend.
The average number of casualties per 1,000 fire incidents is 3. This indicator was the highest - 42 in 2003, and the lowest 0 in 2002. The trend for injuries per 1,000 fires is constant. Compared to the state value the number of injuries per 1,000 incidents is lower.
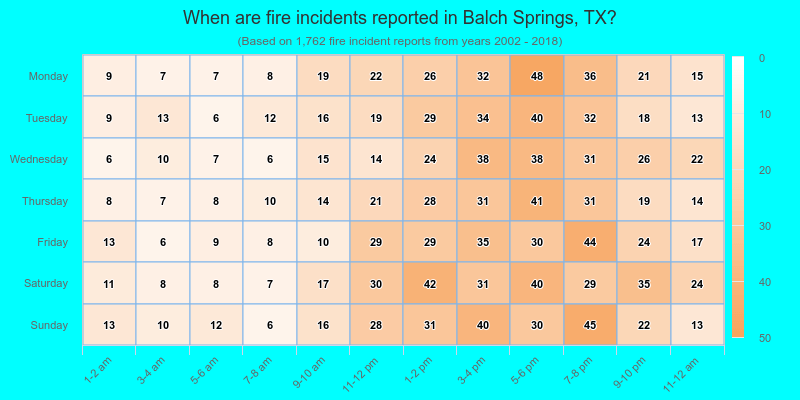
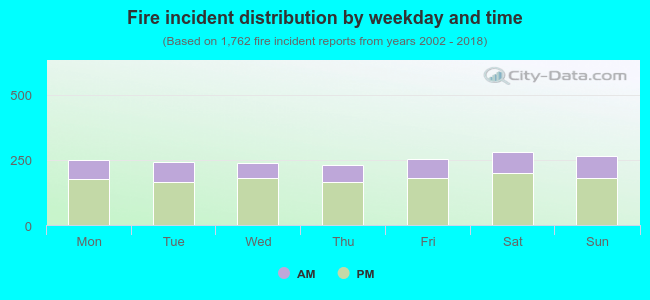 29.2% incidents where reported in the morning and 70.8% in the evening. The most fires (16.0%) took place on Saturday, and the least (13.2%) on Thursday.
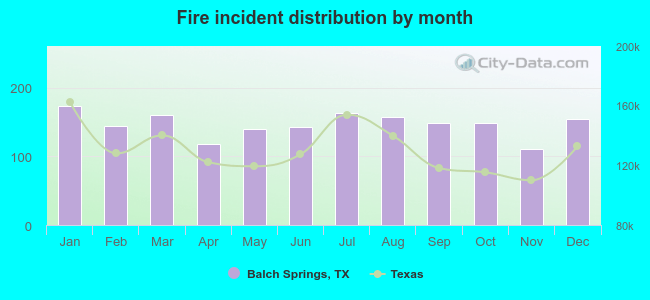 Based on the 1,762 fire incidents from years 2002 - 2018 most fires (9.9%) took place during January, and the least (6.3%) in November.
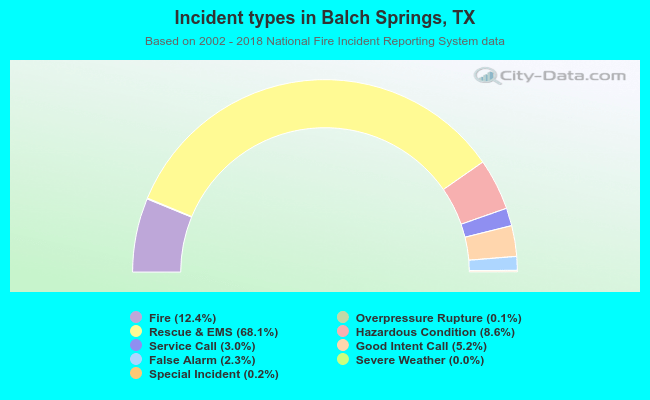 Out of all 14,164 cases reported during the years 2002 - 2018, the most belonged to the categories: Rescue & EMS (68.1%), Fire (12.4%), and Hazardous Condition (8.6%).
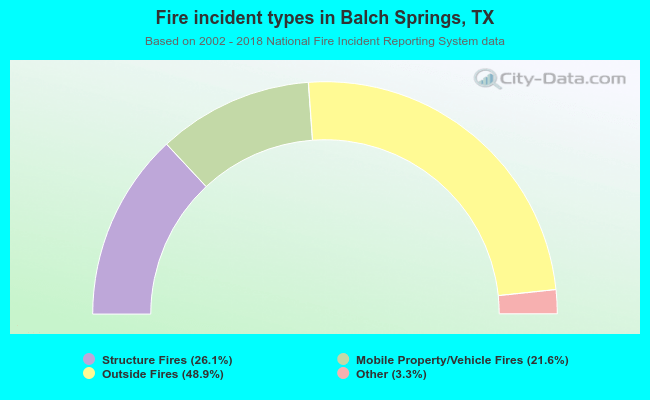 When looking into fire subcategories, the most reports belonged to: Outside Fires (48.9%), and Structure Fires (26.1%).