Seagoville: Fire Incidents, Texas (TX)
Where are fire incidents reported in Seagoville, TX
Something went wrong! Please refresh the page.
| Fire incidents reported | |
|---|---|
| Sreet name | Count |
| SIMONDS RD | 182 |
| KLEBERG RD | 90 |
| 175 EVEN 1500 - 3400 HWY | 86 |
| BOWERS RD | 86 |
| 175 ODD 1501-3399 HWY | 80 |
| 175 EVEN NUMBERS HWY | 74 |
| STARK | 74 |
| 175 EVEN 2300 - 3000 HWY | 66 |
| KAUFMAN | 64 |
| 175 EVEN 1500 3400 HWY | 56 |
| MALLOY BRIDGE RD | 56 |
| US HIGHWAY 175 | 54 |
| 175 ODD 15013399 HWY | 50 |
| 175 EVEN 100-1498 HWY | 46 |
| 175 EVEN 1001498 HWY | 46 |
| MODENE | 44 |
| MALLOY BRIDGE 600 + RD | 40 |
| 175 ODD NUMBERS HWY | 36 |
| CATHERINE ST | 36 |
| MAY RD | 34 |
| HALL 300 + ST | 32 |
| MALLOY BRIDGE 100-500 RD | 32 |
| 175 ODD 101-1499 HWY | 30 |
| ARD RD | 30 |
| SEAGOVILLE 2200 + RD | 30 |
| SHADY | 30 |
| COMBINE RD | 28 |
| MALLOY BRIDGE 600-2000 RD | 26 |
| CLOVERHILL RD | 24 |
| DENNIS CIR | 24 |
| Other | 72 |
2002 - 2018 National Fire Incident Reporting System (NFIRS) incidents
- Incident types reported to NFIRS in Seagoville, TX
- 8,96854.3%Rescue & EMS
- 3,06018.5%Hazardous Condition
- 1,65810.0%Fire
- 1,3848.4%Good Intent Call
- 1,0206.2%Service Call
- 4202.5%False Alarm
- Fire incident types reported to NFIRS in Seagoville, TX
- 87953.0%Outside Fires
- 40524.4%Structure Fires
- 30118.2%Mobile Property/Vehicle Fires
- 734.4%Other
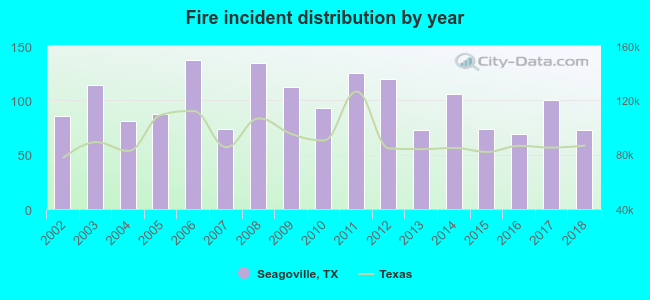 According to the data from the years 2002 - 2018 the average number of fire incidents per year is 98. The highest number of reported fire incidents - 137 took place in 2006, and the least - 69 in 2016. The data has a declining trend.
The average number of yearly fire incidents per 10k residents in Seagoville, TX compared to nearest cities:
(Note: Based on data for the last 3 years, including only cities with population 5,000 and above)
| Seagoville: | 51.3 |
| Balch Springs: | 39.0 |
| Forney: | 71.1 |
| Hutchins: | 76.1 |
| Mesquite: | 31.4 |
| Sunnyvale: | 56.1 |
| Lancaster: | 43.2 |
| Heath: | 31.3 |
| Kaufman: | 162.8 |
 The median response time based on all reported fire incidents is 5 minutes. This is lower compared to the Texas median value.
The median response time in Seagoville, TX compared to nearest cities:
(Note: Based on data for all years, including only cities with at least 500 fire incidents)
| Seagoville: | 5 minutes |
| Crandall: | 8 minutes |
| Balch Springs: | 5 minutes |
| Forney: | 6 minutes |
| Wilmer: | 6 minutes |
| Hutchins: | 6 minutes |
| Mesquite: | 5 minutes |
| Ferris: | 10 minutes |
| Scurry: | 10 minutes |
 According to the reports from the years 2002 - 2018 the average number of fire-related casualties per year is 1. The highest number of reported casualties - 4 took place in 2003, and the lowest - 0 in 2010. The data has a declining trend.
The average number of casualties per 1,000 fires is 10. This indicator was the highest - 35 in 2003, and the lowest 0 in 2010. The trend for casualties per 1,000 fires is decreasing. Compared to the state value the number of casualties per 1,000 fires is higher.
According to the reports from the years 2002 - 2018 the average number of fire-related casualties per year is 1. The highest number of reported casualties - 4 took place in 2003, and the lowest - 0 in 2010. The data has a declining trend.
The average number of casualties per 1,000 fires is 10. This indicator was the highest - 35 in 2003, and the lowest 0 in 2010. The trend for casualties per 1,000 fires is decreasing. Compared to the state value the number of casualties per 1,000 fires is higher.
 29.4% incidents where reported in the morning and 70.6% in the evening. The most fires (16.4%) took place on Saturday, and the least (10.8%) on Thursday.
 According to the 1,658 incident reports from years 2002 - 2018 most fires (11.5%) took place during July, and the least (6.9%) in April.
 Out of all 16,519 cases reported during the years 2002 - 2018, the most belonged to the categories: Rescue & EMS (54.3%), Hazardous Condition (18.5%), and Fire (10.0%).
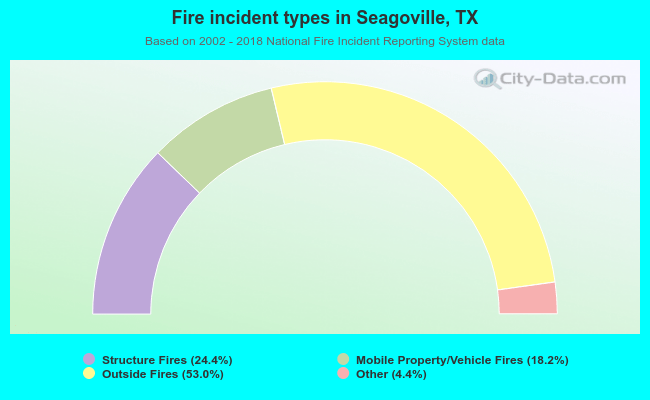 When looking into fire subcategories, the most incidents belonged to: Outside Fires (53.0%), and Structure Fires (24.4%).