Wilmer: Fire Incidents, Texas (TX)
Where are fire incidents reported in Wilmer, TX
Something went wrong! Please refresh the page.
|
| |||||||||||||||||||||||||||||||||||||||||||||||||||||||||||||||||||||||||||||||||||||||||||||||||||||||||||||
2002 - 2018 National Fire Incident Reporting System (NFIRS) incidents
- Incident types reported to NFIRS in Wilmer, TX
- 3,07151.7%Rescue & EMS
- 94315.9%Fire
- 84714.2%Service Call
- 5088.5%Hazardous Condition
- 4006.7%Good Intent Call
- 1702.9%False Alarm
- Fire incident types reported to NFIRS in Wilmer, TX
- 47550.4%Outside Fires
- 25627.1%Structure Fires
- 18819.9%Mobile Property/Vehicle Fires
- 242.5%Other
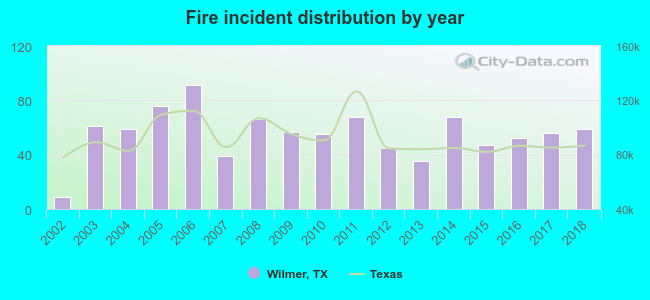 According to the data from the years 2002 - 2018 the average number of fire incidents per year is 55. The highest number of reported fire incidents - 91 took place in 2006, and the least - 9 in 2002. The data has a rising trend.
 The median response time based on all reported fire incidents is 6 minutes. This is comparable to the state median value.
The median response time in Wilmer, TX compared to nearest cities:
(Note: Based on data for all years, including only cities with at least 500 fire incidents)
| Wilmer: | 6 minutes |
| Hutchins: | 6 minutes |
| Ferris: | 10 minutes |
| Lancaster: | 6 minutes |
| Red Oak: | 6 minutes |
| Seagoville: | 5 minutes |
| Balch Springs: | 5 minutes |
| Glenn Heights: | 5 minutes |
| DeSoto: | 6 minutes |
 30.5% incidents where reported in the morning and 69.5% in the evening. The most fires (17.1%) took place on Friday, and the least (11.9%) on Wednesday.
 Based on the 943 reports from years 2002 - 2018 most fires (11.7%) took place during July, and the least (3.7%) in April.
 Out of all 5,945 cases reported during the years 2002 - 2018, the most belonged to the categories: Rescue & EMS (51.7%), Fire (15.9%), and Service Call (14.2%).
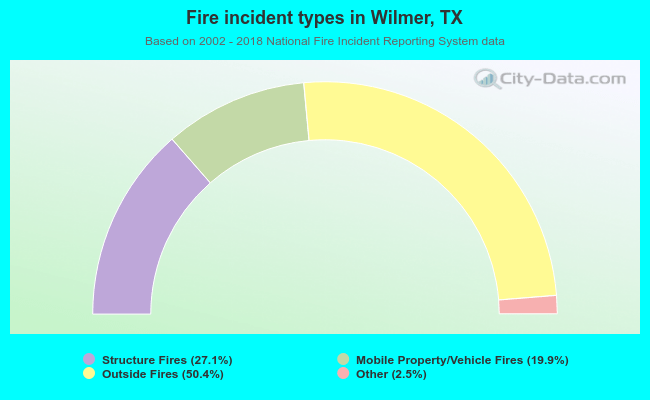 When looking into fire subcategories, the most incidents belonged to: Outside Fires (50.4%), and Structure Fires (27.1%).