Benton Harbor: Fire Incidents, Michigan (MI)
Where are fire incidents reported in Benton Harbor, MI
Something went wrong! Please refresh the page.
| Fire incidents reported | |
|---|---|
| Sreet name | Count |
| NAPIER AVE | 194 |
| EMPIRE AVE | 186 |
| EMPIRE | 176 |
| PIPESTONE | 144 |
| TERRITORIAL RD | 142 |
| NAPIER | 136 |
| BROADWAY AVE | 126 |
| PAVONE ST | 124 |
| WALL ST | 124 |
| COLFAX AVE | 112 |
| BRITAIN AVE | 110 |
| MAIN ST | 106 |
| HIGHLAND AVE | 98 |
| PAVONE | 96 |
| TERRITORIAL | 86 |
| SUPERIOR ST | 80 |
| COLUMBUS AVE | 72 |
| UNION | 72 |
| COLFAX | 70 |
| HIGHLAND | 70 |
| PEARL ST | 70 |
| PAW PAW AVE | 68 |
| PIPESTONE ST | 68 |
| BROADWAY | 66 |
| CRYSTAL AVE | 66 |
| PIPESTONE RD | 64 |
| M-139 | 60 |
| OGDEN | 60 |
| PEARL | 58 |
| COLUMBUS | 56 |
| Other | 1,293 |
2002 - 2018 National Fire Incident Reporting System (NFIRS) incidents
- Incident types reported to NFIRS in Benton Harbor, MI
- 4,25337.7%Fire
- 2,24219.9%Hazardous Condition
- 1,52613.5%Service Call
- 1,39812.4%False Alarm
- 1,27711.3%Good Intent Call
- 4964.4%Rescue & EMS
- 610.5%Special Incident
- 320.3%Overpressure Rupture
- Fire incident types reported to NFIRS in Benton Harbor, MI
- 2,48558.4%Structure Fires
- 91921.6%Outside Fires
- 70816.6%Mobile Property/Vehicle Fires
- 1413.3%Other
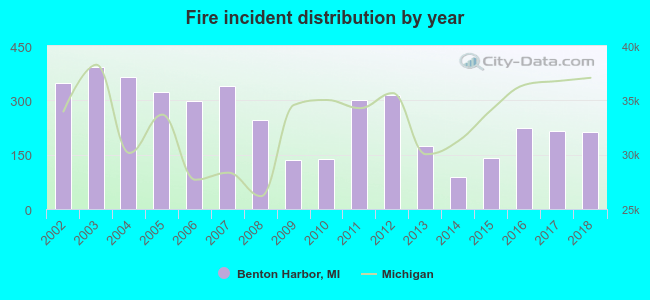 Based on the data from the years 2002 - 2018 the average number of fire incidents per year is 250. The highest number of reported fire incidents - 392 took place in 2003, and the least - 89 in 2014. The data has a decreasing trend.
The average number of yearly fire incidents per 10k residents in Benton Harbor, MI compared to nearest cities:
(Note: Based on data for the last 3 years, including only cities with population 5,000 and above)
| Benton Harbor: | 216.3 |
| Dowagiac: | 121.2 |
| Niles: | 131.9 |
| Allegan: | 153.8 |
| Three Rivers: | 23.2 |
| Portage: | 23.9 |
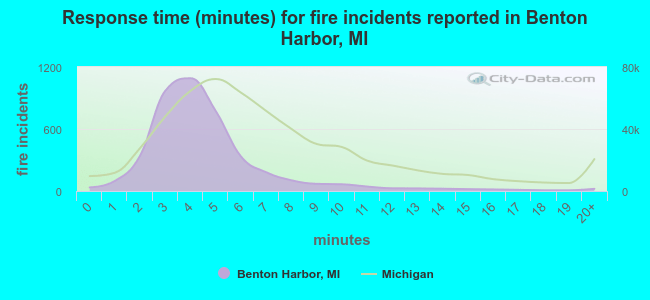 The median response time based on all reported fire incidents is 4 minutes. This is lower than the Michigan median value.
The median response time in Benton Harbor, MI compared to nearest cities:
(Note: Based on data for all years, including only cities with at least 500 fire incidents)
| Benton Harbor: | 4 minutes |
| Coloma: | 9 minutes |
| Berrien Springs: | 10 minutes |
| Hartford: | 7 minutes |
| Dowagiac: | 8 minutes |
| Buchanan: | 9 minutes |
| South Haven: | 6 minutes |
| Niles: | 6 minutes |
| Bangor: | 8 minutes |
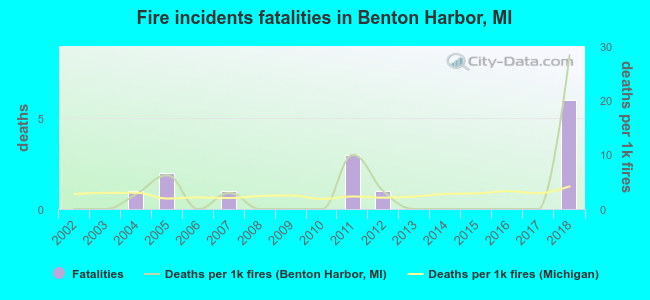 Based on the data from the years 2002 - 2018 the average number of fire-related yearly deaths is 1. The highest number of deaths - 6 took place in 2018, and the lowest - 0 in 2002. The data has an increasing trend.
The average number of fatalities per 1,000 fires is 3. This indicator was the highest - 28 in 2018, and the lowest 0 in 2002. The trend for fatalities per 1,000 incidents is growing. Compared to the Michigan value the number of fatalities per 1,000 fires is higher.
Based on the data from the years 2002 - 2018 the average number of fire-related yearly deaths is 1. The highest number of deaths - 6 took place in 2018, and the lowest - 0 in 2002. The data has an increasing trend.
The average number of fatalities per 1,000 fires is 3. This indicator was the highest - 28 in 2018, and the lowest 0 in 2002. The trend for fatalities per 1,000 incidents is growing. Compared to the Michigan value the number of fatalities per 1,000 fires is higher.Deaths per 1,000 incidents in Benton Harbor, MI compared to nearest cities:
(Note: Based on data for all years, including only cities with at least 2,500 fire incidents)
| Benton Harbor: | 3.3 |
| Niles: | 4.4 |
| South Bend: | 0.6 |
| Michigan City: | 1.9 |
| Elkhart: | 2.8 |
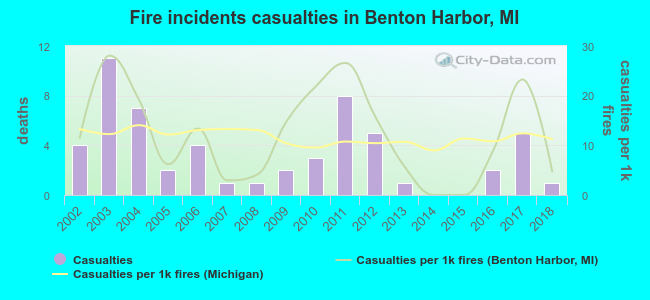 Based on the data from the years 2002 - 2018 the average number of fire-related casualties per year is 3. The highest number of casualties - 11 took place in 2003, and the lowest - 0 in 2014. The data has a declining trend.
The average number of casualties per 1,000 fires is 12. This indicator was the highest - 28 in 2003, and the lowest 0 in 2014. The trend for casualties per 1,000 incidents is declining. Compared to the state value the number of casualties per 1,000 incidents is similar.
Based on the data from the years 2002 - 2018 the average number of fire-related casualties per year is 3. The highest number of casualties - 11 took place in 2003, and the lowest - 0 in 2014. The data has a declining trend.
The average number of casualties per 1,000 fires is 12. This indicator was the highest - 28 in 2003, and the lowest 0 in 2014. The trend for casualties per 1,000 incidents is declining. Compared to the state value the number of casualties per 1,000 incidents is similar.Casualties per 1,000 incidents in Benton Harbor, MI compared to nearest cities:
(Note: Based on data for all years, including only cities with at least 500 fire incidents)
| Benton Harbor: | 13.4 |
| Coloma: | 0.0 |
| Berrien Springs: | 5.5 |
| Hartford: | 0.0 |
| Dowagiac: | 18.2 |
| Buchanan: | 0.0 |
| South Haven: | 23.2 |
| Niles: | 4.7 |
| Bangor: | 1.8 |
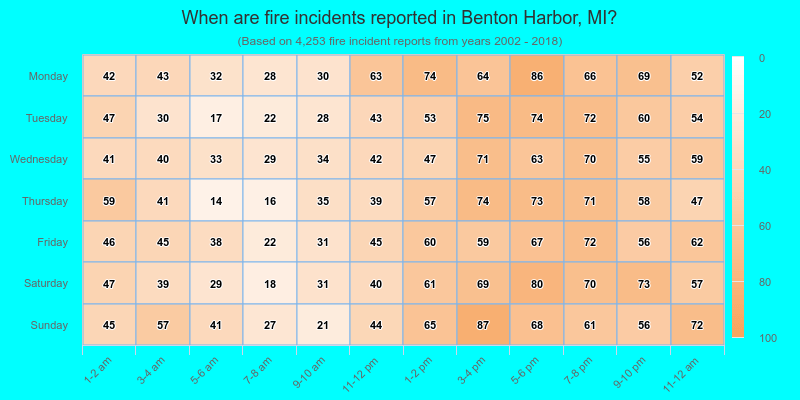
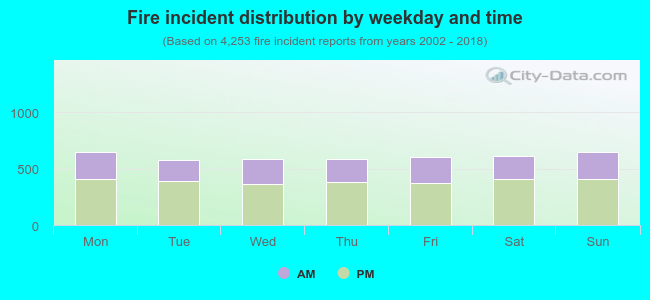 35.6% incidents where reported in the morning and 64.4% in the evening. The most fires (15.3%) took place on Monday, and the least (13.5%) on Tuesday.
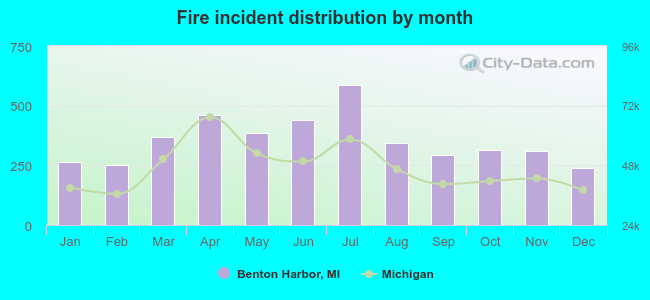 According to the 4,253 incident reports from years 2002 - 2018 most fires (13.8%) took place during July, and the least (5.6%) in December.
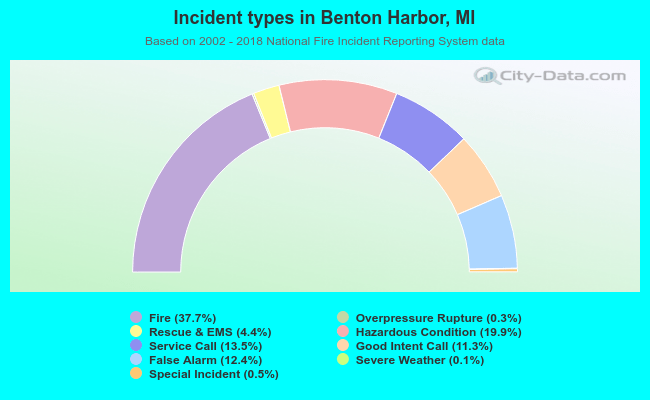 Out of all 11,294 cases reported during the years 2002 - 2018, the most belonged to the categories: Fire (37.7%), Hazardous Condition (19.9%), and Service Call (13.5%).
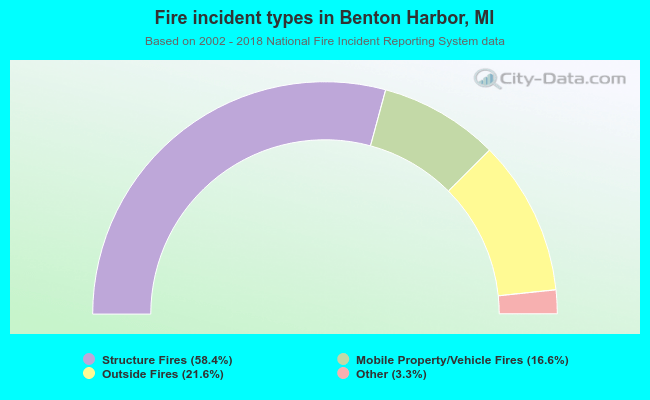 When looking into fire subcategories, the most reports belonged to: Structure Fires (58.4%), and Outside Fires (21.6%).