Brentwood: Fire Incidents, New York (NY)
Where are fire incidents reported in Brentwood, NY
Something went wrong! Please refresh the page.
| Fire incidents reported | |
|---|---|
| Sreet name | Count |
| CROOKED HILL RD | 274 |
| SUFFOLK AVE | 166 |
| WICKS RD | 98 |
| BRENTWOOD RD | 94 |
| HILLTOP DR | 86 |
| LONG ISLAND EXPY | 76 |
| SAGTIKOS PKWY | 68 |
| SECOND AVE | 64 |
| BROADWAY | 56 |
| LONG ISLAND AVE | 48 |
| ISLIP AVE | 44 |
| LONG ISLAND EXPRESSWAY | 42 |
| WASHINGTON AVE CO 2 AREA | 42 |
| BRADLEY ST | 36 |
| GRAND BLVD | 34 |
| WESTWOOD DR | 34 |
| CLAYWOOD DR | 32 |
| SOUTHERN STATE PKWY | 32 |
| SPRINGFIELD RD | 32 |
| YARNELL ST | 32 |
| BISHOP RD | 30 |
| COMMACK RD | 30 |
| AMERICAN BLVD | 28 |
| MADISON AVE CO 2 AREA | 28 |
| WASHINGTON AVE | 28 |
| DOOLITTLE ST | 26 |
| FIRST ST | 26 |
| FOURTH ST | 26 |
| SHERMAN ST | 26 |
| SIXTH AVE | 26 |
| Other | 561 |
2003 - 2018 National Fire Incident Reporting System (NFIRS) incidents
- Incident types reported to NFIRS in Brentwood, NY
- 2,98435.4%Hazardous Condition
- 2,22526.4%Fire
- 1,36416.2%False Alarm
- 1,01612.1%Rescue & EMS
- 4825.7%Good Intent Call
- 3063.6%Service Call
- 320.4%Severe Weather
- 100.1%Overpressure Rupture
- Fire incident types reported to NFIRS in Brentwood, NY
- 85438.4%Outside Fires
- 82337.0%Structure Fires
- 48821.9%Mobile Property/Vehicle Fires
- 602.7%Other
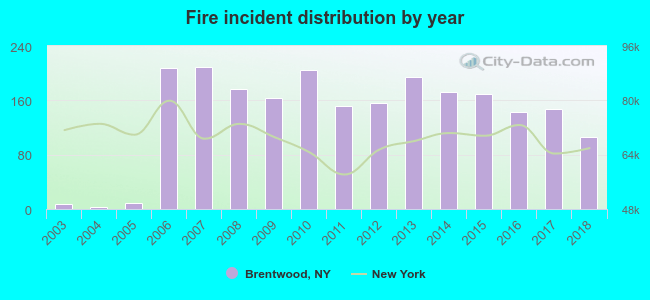 Based on the data from the years 2003 - 2018 the average number of fires per year is 139. The highest number of reported fire incidents - 209 took place in 2007, and the least - 3 in 2004. The data has a growing trend.
The average number of yearly fire incidents per 10k residents in Brentwood, NY compared to nearest cities:
(Note: Based on data for the last 3 years, including only cities with population 5,000 and above)
| Brentwood: | 21.8 |
| Central Islip: | 27.4 |
| Hauppauge: | 30.2 |
| Islip: | 4.0 |
| Bay Shore: | 44.6 |
| Islip Terrace: | 14.2 |
| East Islip: | 6.9 |
| Deer Park: | 9.4 |
| Commack: | 5.4 |
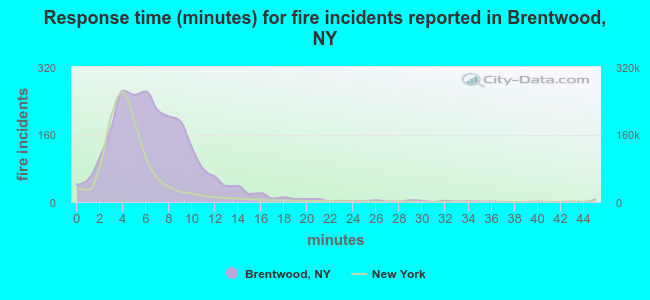 The median response time based on all reported fire incidents is 6 minutes. This is higher compared to the New York median value.
The median response time in Brentwood, NY compared to nearest cities:
(Note: Based on data for all years, including only cities with at least 500 fire incidents)
| Brentwood: | 6 minutes |
| Central Islip: | 5 minutes |
| Hauppauge: | 4 minutes |
| Bay Shore: | 4 minutes |
| Commack: | 5 minutes |
| Smithtown: | 6 minutes |
| West Islip: | 3 minutes |
| Ronkonkoma: | 6 minutes |
| Bohemia: | 4 minutes |
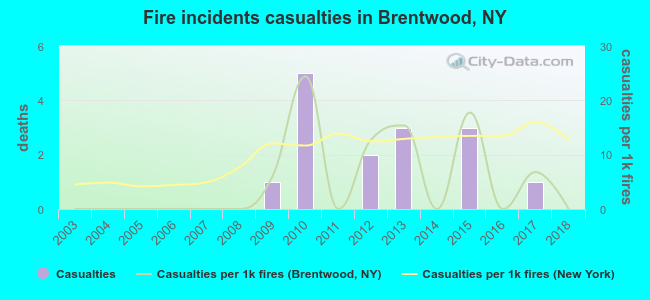 Based on the reports from the years 2003 - 2018 the average number of fire-related yearly casualties is 1. The highest number of reported injuries - 5 took place in 2010, and the lowest - 0 in 2003. The data has a constant trend.
The average number of injuries per 1,000 fires is 5. This indicator was the highest - 24 in 2010, and the lowest 0 in 2003. The trend for casualties per 1,000 incidents is decreasing. Compared to the New York value the number of injuries per 1,000 fire incidents is lower.
Based on the reports from the years 2003 - 2018 the average number of fire-related yearly casualties is 1. The highest number of reported injuries - 5 took place in 2010, and the lowest - 0 in 2003. The data has a constant trend.
The average number of injuries per 1,000 fires is 5. This indicator was the highest - 24 in 2010, and the lowest 0 in 2003. The trend for casualties per 1,000 incidents is decreasing. Compared to the New York value the number of injuries per 1,000 fire incidents is lower.Casualties per 1,000 incidents in Brentwood, NY compared to nearest cities:
(Note: Based on data for all years, including only cities with at least 500 fire incidents)
| Brentwood: | 6.7 |
| Central Islip: | 0.0 |
| Hauppauge: | 28.6 |
| Bay Shore: | 7.8 |
| Commack: | 1.6 |
| Smithtown: | 4.5 |
| West Islip: | 22.1 |
| Ronkonkoma: | 7.7 |
| Bohemia: | 0.0 |
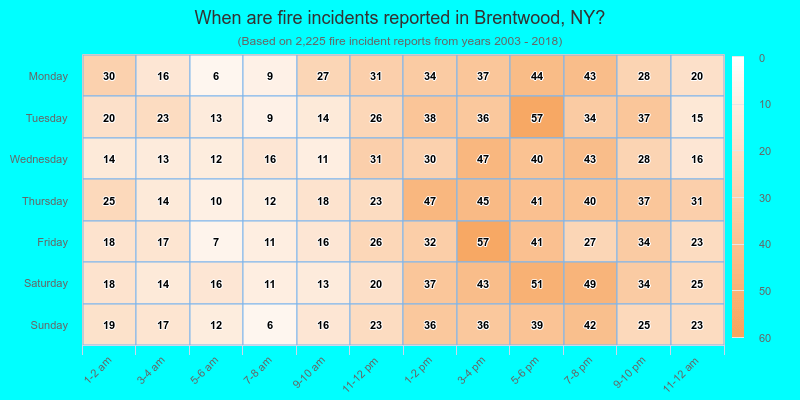
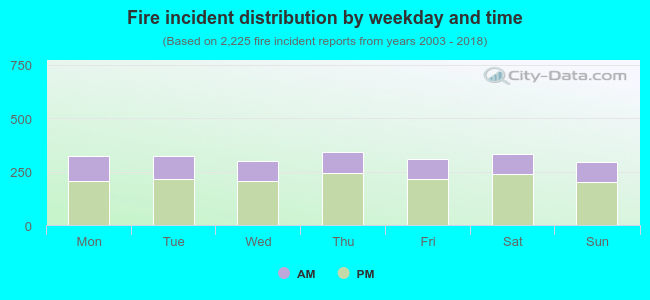 31.6% incidents where reported in the morning and 68.4% in the evening. The most fires (15.4%) took place on Thursday, and the least (13.2%) on Sunday.
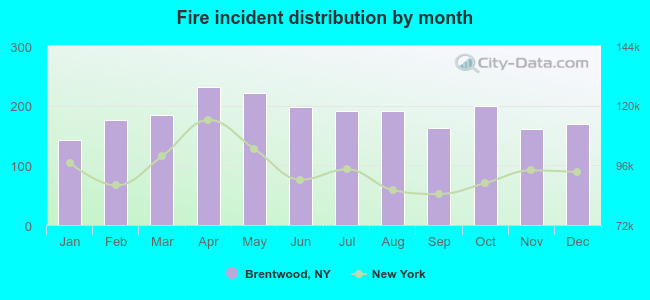 Based on the 2,225 incident reports from years 2003 - 2018 most fires (10.4%) took place during April, and the least (6.4%) in January.
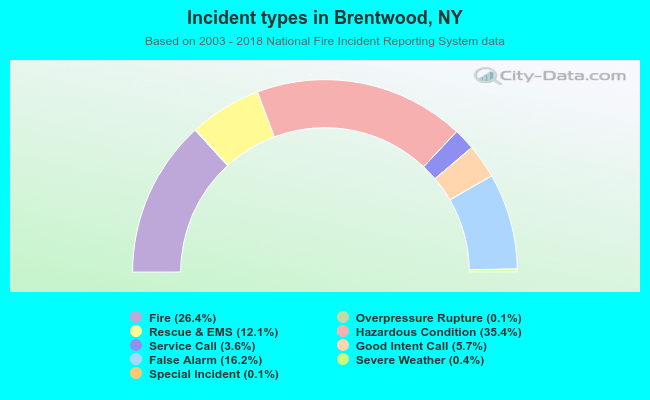 Out of all 8,426 cases reported during the years 2003 - 2018, the most belonged to the categories: Hazardous Condition (35.4%), Fire (26.4%), and False Alarm (16.2%).
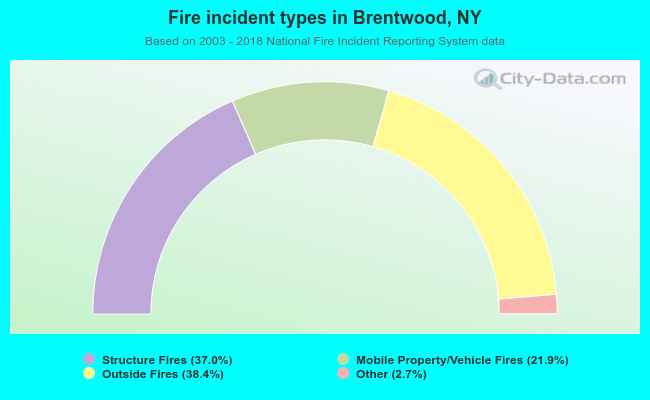 When looking into fire subcategories, the most reports belonged to: Outside Fires (38.4%), and Structure Fires (37.0%).