Commack: Fire Incidents, New York (NY)
Where are fire incidents reported in Commack, NY
Something went wrong! Please refresh the page.
|
| |||||||||||||||||||||||||||||||||||||||||||||||||||||||||||||||||||||||||||||||||||||||||||||||||||||||||||||
2003 - 2018 National Fire Incident Reporting System (NFIRS) incidents
- Incident types reported to NFIRS in Commack, NY
- 2,36435.4%Hazardous Condition
- 1,61324.2%False Alarm
- 1,03115.5%Rescue & EMS
- 71110.7%Good Intent Call
- 6209.3%Fire
- 3074.6%Service Call
- 110.2%Severe Weather
- 80.1%Special Incident
- 70.1%Overpressure Rupture
- Fire incident types reported to NFIRS in Commack, NY
- 26242.3%Outside Fires
- 21234.2%Structure Fires
- 9815.8%Mobile Property/Vehicle Fires
- 487.7%Other
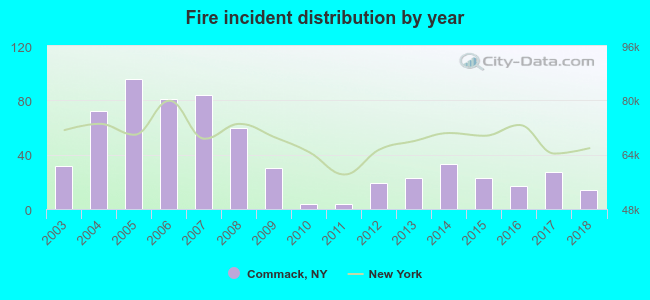 According to the data from the years 2003 - 2018 the average number of fires per year is 39. The highest number of fire incidents - 96 took place in 2005, and the least - 4 in 2010. The data has a declining trend.
The average number of yearly fire incidents per 10k residents in Commack, NY compared to nearest cities:
(Note: Based on data for the last 3 years, including only cities with population 5,000 and above)
| Commack: | 5.4 |
| East Northport: | 6.1 |
| Smithtown: | 18.5 |
| Kings Park: | 10.6 |
| Dix Hills: | 2.2 |
| Hauppauge: | 30.2 |
| Greenlawn: | 5.1 |
| Brentwood: | 21.8 |
| Northport: | 32.8 |
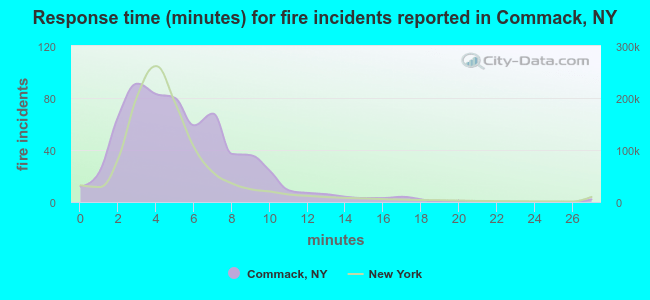 The median response time based on all reported fire incidents is 5 minutes. This is higher than the New York median value.
The median response time in Commack, NY compared to nearest cities:
(Note: Based on data for all years, including only cities with at least 500 fire incidents)
| Commack: | 5 minutes |
| Smithtown: | 6 minutes |
| Hauppauge: | 4 minutes |
| Brentwood: | 6 minutes |
| Central Islip: | 5 minutes |
| Huntington Station: | 4 minutes |
| Wyandanch: | 3 minutes |
| Bay Shore: | 4 minutes |
| Ronkonkoma: | 6 minutes |
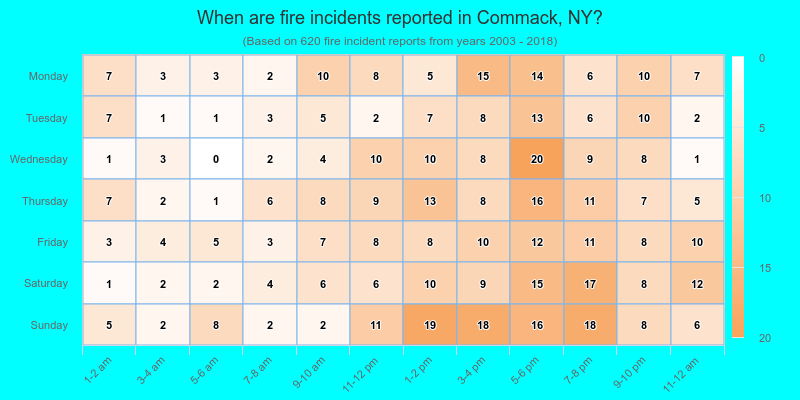
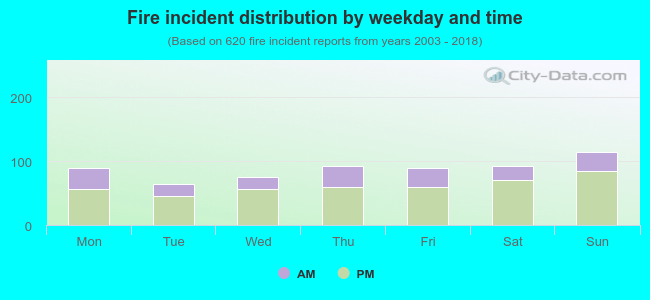 30.0% incidents where reported in the morning and 70.0% in the evening. The most fires (18.5%) took place on Sunday, and the least (10.5%) on Tuesday.
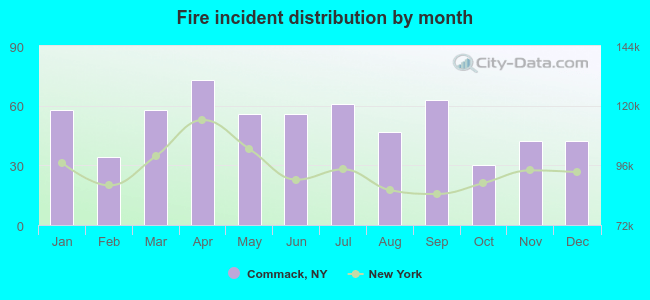 Based on the 620 fire incident reports from years 2003 - 2018 most fires (11.8%) took place during April, and the least (4.8%) in October.
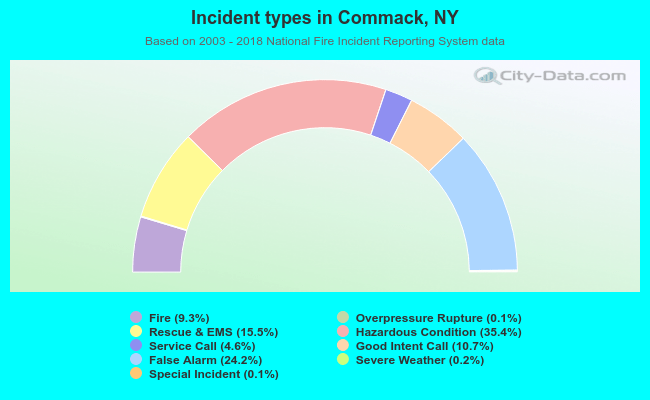 Out of all 6,672 cases reported during the years 2003 - 2018, the most belonged to the categories: Hazardous Condition (35.4%), False Alarm (24.2%), and Rescue & EMS (15.5%).
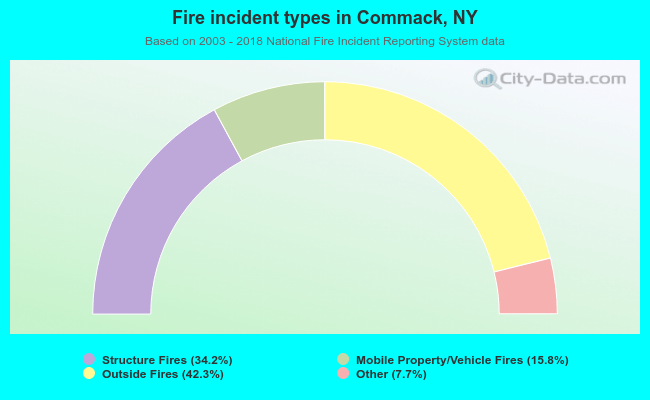 When looking into fire subcategories, the most reports belonged to: Outside Fires (42.3%), and Structure Fires (34.2%).