Bohemia: Fire Incidents, New York (NY)
Where are fire incidents reported in Bohemia, NY
Something went wrong! Please refresh the page.
|
| |||||||||||||||||||||||||||||||||||||||||||||||||||||||||||||||||||||||||||||||||||||||||||||||||||||||||||||
2002 - 2018 National Fire Incident Reporting System (NFIRS) incidents
- Incident types reported to NFIRS in Bohemia, NY
- 4,15964.8%Rescue & EMS
- 6149.6%Hazardous Condition
- 5428.4%Good Intent Call
- 5268.2%Fire
- 4176.5%False Alarm
- 1272.0%Service Call
- 320.5%Severe Weather
- Fire incident types reported to NFIRS in Bohemia, NY
- 19837.6%Outside Fires
- 18435.0%Structure Fires
- 8616.3%Mobile Property/Vehicle Fires
- 5811.0%Other
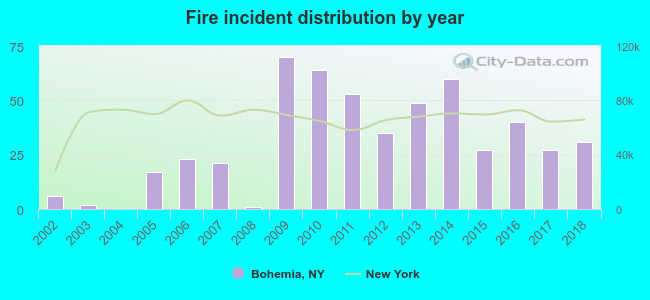 Based on the data from the years 2002 - 2018 the average number of fires per year is 31. The highest number of reported fire incidents - 70 took place in 2009, and the least - 0 in 2004. The data has a growing trend.
The average number of yearly fire incidents per 10k residents in Bohemia, NY compared to nearest cities:
(Note: Based on data for the last 3 years, including only cities with population 5,000 and above)
| Bohemia: | 32.1 |
| Sayville: | 13.4 |
| Oakdale: | 31.4 |
| West Sayville: | 19.3 |
| Holbrook: | 12.7 |
| Ronkonkoma: | 43.0 |
| Bayport: | 7.1 |
| Islip Terrace: | 14.2 |
| Lake Ronkonkoma: | 1.0 |
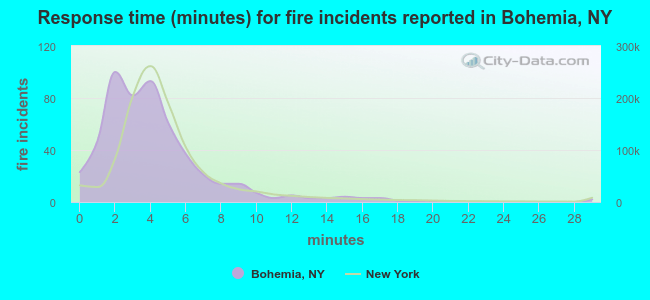 The median response time based on all reported fire incidents is 4 minutes. This is comparable to the New York median value.
The median response time in Bohemia, NY compared to nearest cities:
(Note: Based on data for all years, including only cities with at least 500 fire incidents)
| Bohemia: | 4 minutes |
| Holbrook: | 4 minutes |
| Ronkonkoma: | 6 minutes |
| Central Islip: | 5 minutes |
| Patchogue: | 4 minutes |
| Hauppauge: | 4 minutes |
| East Patchogue: | 4 minutes |
| Brentwood: | 6 minutes |
| Medford: | 4 minutes |
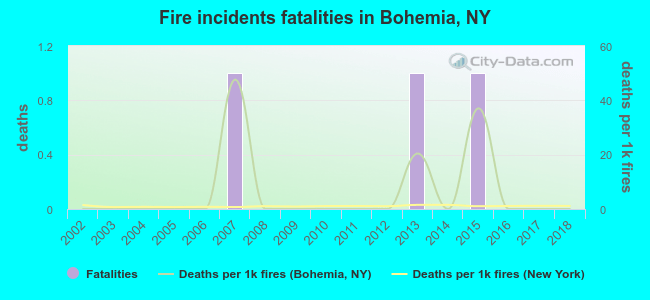 Based on the reports from the years 2002 - 2018 the average number of fire-related yearly deaths is 0. The highest number of reported deaths - 1 took place in 2007, and the lowest - 0 in 2002. The data has a constant trend.
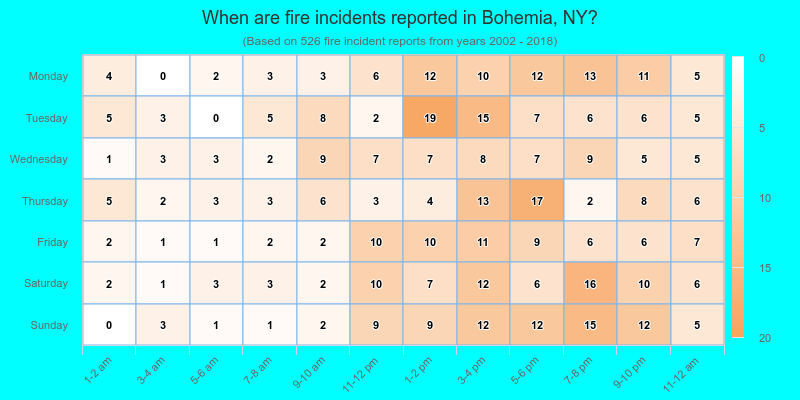
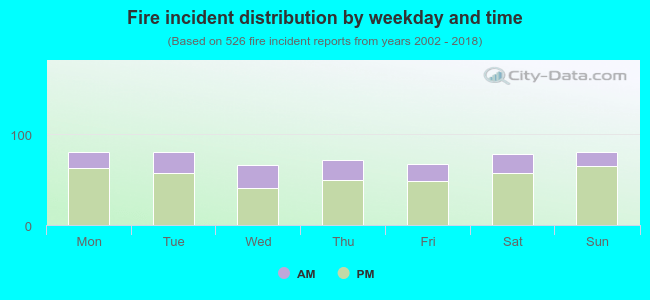 27.2% incidents where reported in the morning and 72.8% in the evening. The most fires (15.4%) took place on Monday, and the least (12.5%) on Wednesday.
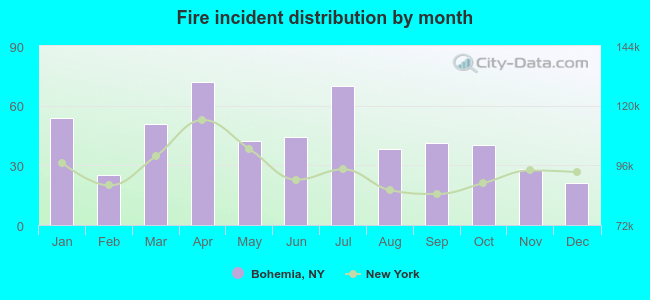 Based on the 526 incident reports from years 2002 - 2018 most fires (13.7%) took place during April, and the least (4.0%) in December.
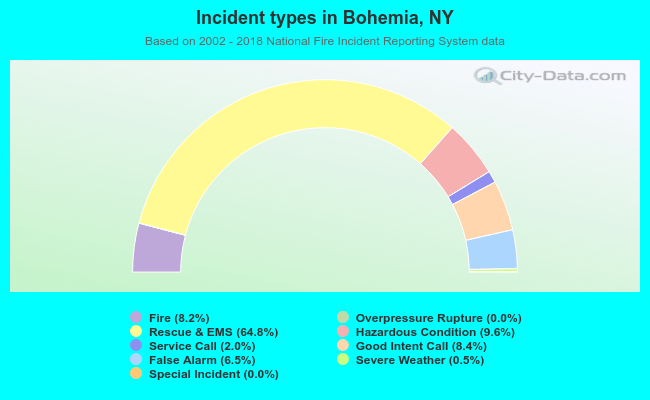 Out of all 6,421 cases reported during the years 2002 - 2018, the most belonged to the categories: Rescue & EMS (64.8%), Hazardous Condition (9.6%), and Good Intent Call (8.4%).
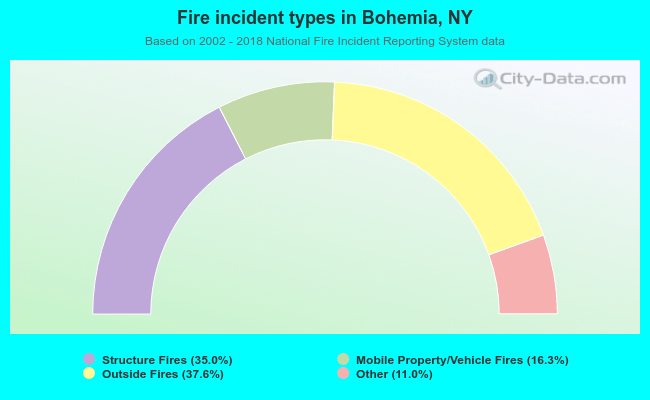 When looking into fire subcategories, the most incidents belonged to: Outside Fires (37.6%), and Structure Fires (35.0%).