Chesapeake: Fire Incidents, Virginia (VA)
Where are fire incidents reported in Chesapeake, VA
Something went wrong! Please refresh the page.
| Fire incidents reported | |
|---|---|
| Sreet name | Count |
| MILITARY HWY | 940 |
| BATTLEFIELD BLVD | 606 |
| PORTSMOUTH BLVD | 292 |
| CEDAR RD | 278 |
| GREENBRIER PKY | 214 |
| CAMPOSTELLA RD | 206 |
| BAINBRIDGE BLVD | 202 |
| GEORGE WASHINGTON HWY | 194 |
| CENTERVILLE TPKE | 152 |
| TAYLOR RD | 142 |
| CROSSWAYS BLVD | 140 |
| WESTERN BRANCH BLVD | 134 |
| BENEFIT RD | 122 |
| INDIAN RIVER RD | 116 |
| BALLAHACK RD | 110 |
| GILMERTON RD | 104 |
| GREAT BRIDGE BLVD | 104 |
| KEMPSVILLE RD | 100 |
| SPARROW RD | 96 |
| DEEP CREEK BLVD | 94 |
| PARKSIDE DR | 94 |
| GENEVA AVE | 88 |
| SAMS CIR | 88 |
| BATTLEFIELD BL | 86 |
| SHILLELAGH RD | 86 |
| CANAL DR | 84 |
| DOMINION BLVD | 84 |
| YADKIN RD | 82 |
| BUELL ST | 80 |
| LIBERTY ST | 78 |
| Other | 6,611 |
2002 - 2018 National Fire Incident Reporting System (NFIRS) incidents
- Incident types reported to NFIRS in Chesapeake, VA
- 110,32367.0%Rescue & EMS
- 11,9987.3%Service Call
- 11,8077.2%Fire
- 11,4677.0%False Alarm
- 11,2606.8%Hazardous Condition
- 6,3133.8%Good Intent Call
- 1,1560.7%Special Incident
- 1950.1%Overpressure Rupture
- Fire incident types reported to NFIRS in Chesapeake, VA
- 5,04642.7%Structure Fires
- 3,81032.3%Outside Fires
- 2,52321.4%Mobile Property/Vehicle Fires
- 4283.6%Other
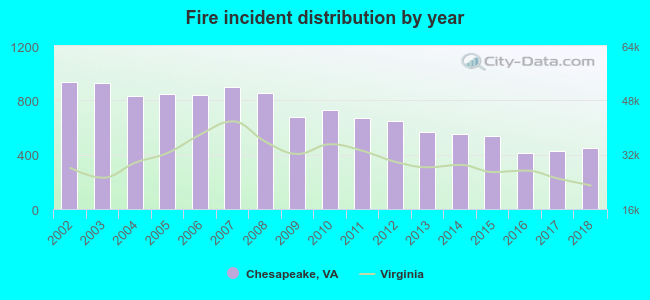 According to the data from the years 2002 - 2018 the average number of fire incidents per year is 695. The highest number of fire incidents - 933 took place in 2002, and the least - 415 in 2016. The data has a dropping trend.
The average number of yearly fire incidents per 10k residents in Chesapeake, VA compared to nearest cities:
(Note: Based on data for the last 3 years, including only cities with population 5,000 and above)
| Chesapeake: | 18.5 |
| Portsmouth: | 39.2 |
| Brambleton: | 3.6 |
| Norfolk: | 30.1 |
| Meadowbrook: | 8.5 |
| Virginia Beach: | 14.1 |
| Suffolk: | 23.3 |
| Hampton: | 28.4 |
| Smithfield: | 57.1 |
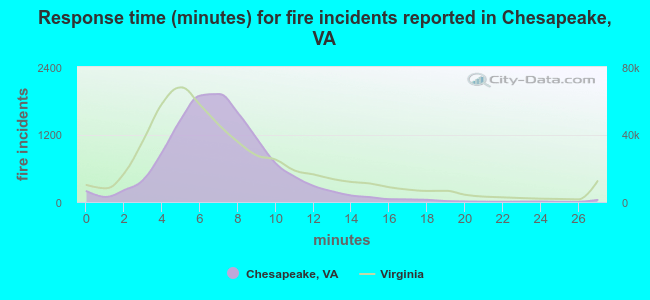 The median response time based on all reported fire incidents is 7 minutes. This is close to the Virginia median value.
The median response time in Chesapeake, VA compared to nearest cities:
(Note: Based on data for all years, including only cities with at least 500 fire incidents)
| Chesapeake: | 7 minutes |
| Portsmouth: | 5 minutes |
| Norfolk: | 4 minutes |
| Virginia Beach: | 7 minutes |
| Suffolk: | 6 minutes |
| Hampton: | 5 minutes |
| Smithfield: | 7 minutes |
| Newport News: | 5 minutes |
| Poquoson: | 4 minutes |
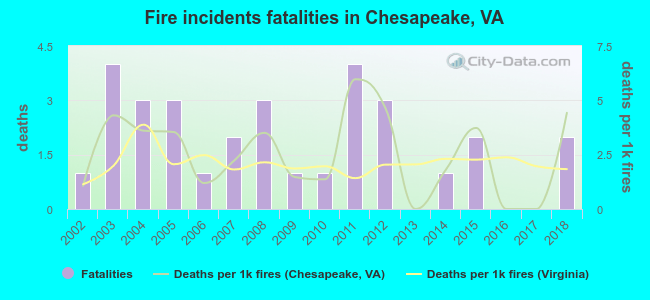 According to the reports from the years 2002 - 2018 the average number of fire-related fatalities per year is 2. The highest number of deaths - 4 took place in 2003, and the lowest - 0 in 2013. The data has an increasing trend.
The average number of deaths per 1,000 fire incidents is 3. This indicator was the highest - 6 in 2011, and the lowest 0 in 2013. The trend for fatalities per 1,000 fires is increasing. Compared to the Virginia value the number of deaths per 1,000 fires is higher.
According to the reports from the years 2002 - 2018 the average number of fire-related fatalities per year is 2. The highest number of deaths - 4 took place in 2003, and the lowest - 0 in 2013. The data has an increasing trend.
The average number of deaths per 1,000 fire incidents is 3. This indicator was the highest - 6 in 2011, and the lowest 0 in 2013. The trend for fatalities per 1,000 fires is increasing. Compared to the Virginia value the number of deaths per 1,000 fires is higher.Deaths per 1,000 incidents in Chesapeake, VA compared to nearest cities:
(Note: Based on data for all years, including only cities with at least 2,500 fire incidents)
| Chesapeake: | 2.6 |
| Portsmouth: | 2.1 |
| Norfolk: | 1.0 |
| Virginia Beach: | 3.1 |
| Suffolk: | 1.7 |
| Hampton: | 2.5 |
| Newport News: | 2.1 |
| Elizabeth City: | 0.4 |
| Williamsburg: | 2.2 |
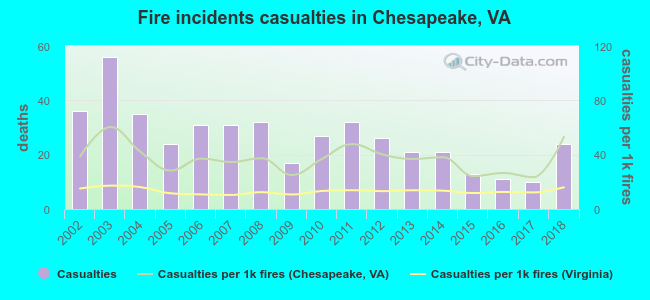 Based on the reports from the years 2002 - 2018 the average number of fire-related casualties per year is 26. The highest number of reported injuries - 56 took place in 2003, and the lowest - 10 in 2017. The data has a decreasing trend.
The average number of injuries per 1,000 fire incidents is 37. This indicator was the highest - 60 in 2003, and the lowest 23 in 2017. The trend for casualties per 1,000 fires is growing. Compared to the Virginia value the number of injuries per 1,000 fires is much higher.
Based on the reports from the years 2002 - 2018 the average number of fire-related casualties per year is 26. The highest number of reported injuries - 56 took place in 2003, and the lowest - 10 in 2017. The data has a decreasing trend.
The average number of injuries per 1,000 fire incidents is 37. This indicator was the highest - 60 in 2003, and the lowest 23 in 2017. The trend for casualties per 1,000 fires is growing. Compared to the Virginia value the number of injuries per 1,000 fires is much higher.Casualties per 1,000 incidents in Chesapeake, VA compared to nearest cities:
(Note: Based on data for all years, including only cities with at least 500 fire incidents)
| Chesapeake: | 37.9 |
| Portsmouth: | 3.9 |
| Norfolk: | 9.0 |
| Virginia Beach: | 41.3 |
| Suffolk: | 5.5 |
| Hampton: | 19.6 |
| Smithfield: | 4.9 |
| Newport News: | 39.0 |
| Poquoson: | 17.4 |
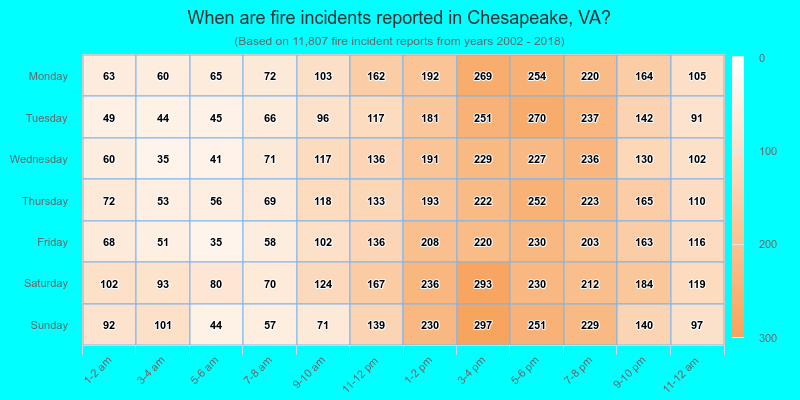
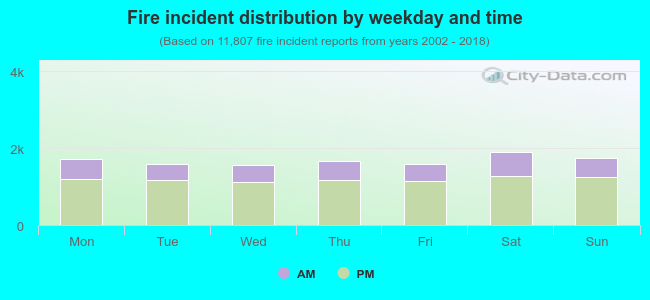 29.6% incidents where reported in the morning and 70.4% in the evening. The most fires (16.2%) took place on Saturday, and the least (13.3%) on Wednesday.
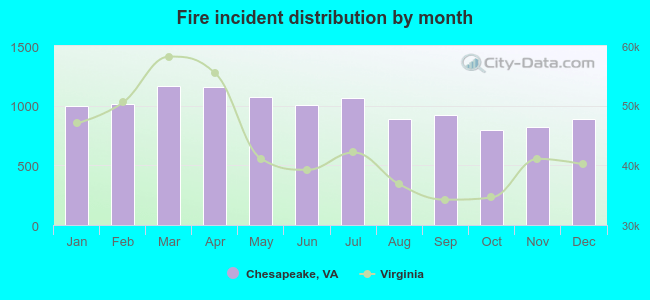 According to the 11,807 reports from years 2002 - 2018 most fires (9.9%) took place during March, and the least (6.8%) in October.
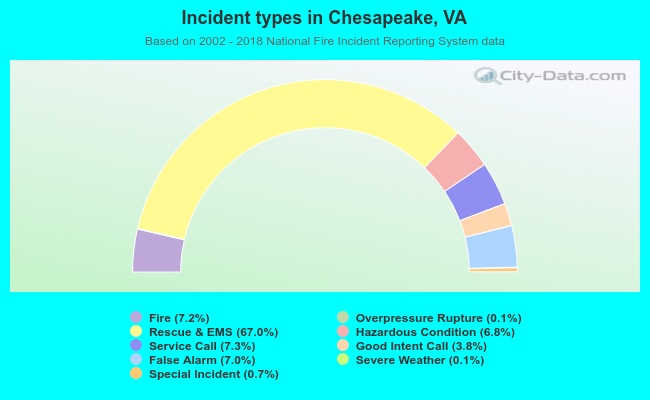 Out of all 164,620 cases reported during the years 2002 - 2018, the most belonged to the categories: Rescue & EMS (67.0%), Service Call (7.3%), and Fire (7.2%).
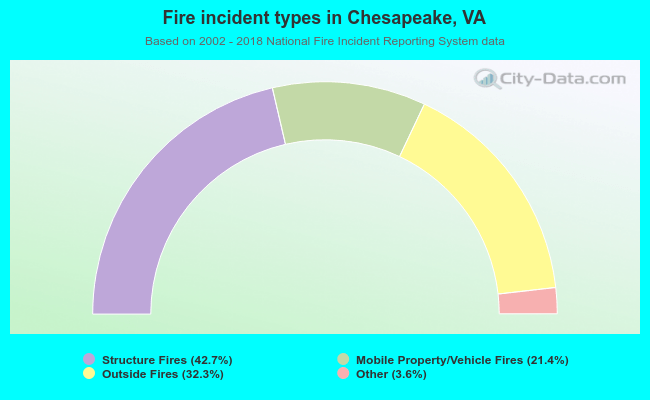 When looking into fire subcategories, the most incidents belonged to: Structure Fires (42.7%), and Outside Fires (32.3%).