Hampton: Fire Incidents, Virginia (VA)
Where are fire incidents reported in Hampton, VA
Something went wrong! Please refresh the page.
| Fire incidents reported | |
|---|---|
| Sreet name | Count |
| MERCURY BLVD | 1,120 |
| PEMBROKE AVE | 522 |
| COLISEUM DR | 352 |
| ARMISTEAD AVE | 288 |
| CUNNINGHAM DR | 276 |
| LASALLE AVE | 270 |
| KECOUGHTAN RD | 218 |
| BRIARFIELD RD | 210 |
| QUEEN ST | 196 |
| KING ST | 192 |
| I64 RTE | 180 |
| BIG BETHEL RD | 170 |
| ABERDEEN RD | 164 |
| SHELL RD | 158 |
| MARCELLA RD | 154 |
| MALLORY ST | 140 |
| VICTORIA BLVD | 134 |
| OLD BUCKROE RD | 130 |
| MICHIGAN DR | 118 |
| FOX HILL RD | 112 |
| I-64 | 112 |
| SETTLERS LANDING RD | 112 |
| WOODLAND RD | 112 |
| I-64 RTE | 108 |
| GOLDSBORO DR | 94 |
| NICKERSON BLVD | 92 |
| LAKESHORE DR | 90 |
| LINCOLN ST | 86 |
| TOWNE CENTRE WAY | 84 |
| BEACH RD | 80 |
| Other | 2,837 |
2002 - 2018 National Fire Incident Reporting System (NFIRS) incidents
- Incident types reported to NFIRS in Hampton, VA
- 98,88166.6%Rescue & EMS
- 13,6029.2%Hazardous Condition
- 9,9006.7%Service Call
- 9,3256.3%False Alarm
- 8,9116.0%Fire
- 7,0944.8%Good Intent Call
- 3430.2%Special Incident
- 2080.1%Overpressure Rupture
- Fire incident types reported to NFIRS in Hampton, VA
- 3,31837.2%Outside Fires
- 3,24236.4%Structure Fires
- 1,59117.9%Mobile Property/Vehicle Fires
- 7608.5%Other
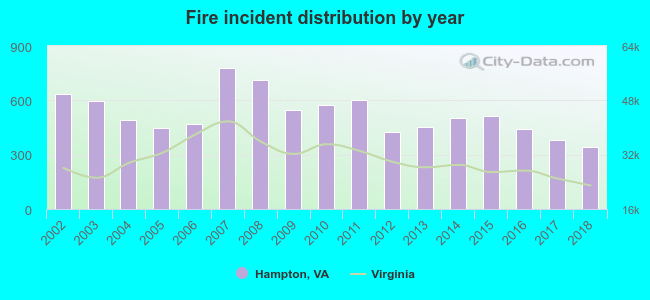 According to the data from the years 2002 - 2018 the average number of fire incidents per year is 524. The highest number of reported fire incidents - 777 took place in 2007, and the least - 343 in 2018. The data has a decreasing trend.
The average number of yearly fire incidents per 10k residents in Hampton, VA compared to nearest cities:
(Note: Based on data for the last 3 years, including only cities with population 5,000 and above)
| Hampton: | 28.4 |
| Poquoson: | 23.2 |
| Newport News: | 28.0 |
| Meadowbrook: | 8.5 |
| Norfolk: | 30.1 |
| Brambleton: | 3.6 |
| Portsmouth: | 39.2 |
| Smithfield: | 57.1 |
| Chesapeake: | 18.5 |
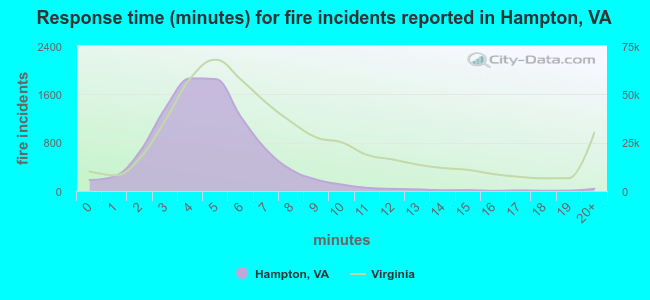 The median response time based on all reported fire incidents is 5 minutes. This is lower compared to the Virginia median value.
The median response time in Hampton, VA compared to nearest cities:
(Note: Based on data for all years, including only cities with at least 500 fire incidents)
| Hampton: | 5 minutes |
| Poquoson: | 4 minutes |
| Newport News: | 5 minutes |
| Norfolk: | 4 minutes |
| Portsmouth: | 5 minutes |
| Smithfield: | 7 minutes |
| Yorktown: | 5 minutes |
| Chesapeake: | 7 minutes |
| Virginia Beach: | 7 minutes |
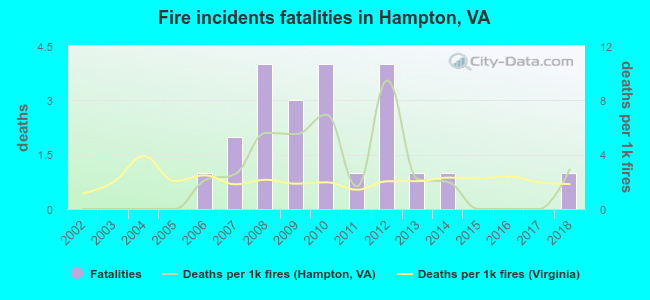 According to the reports from the years 2002 - 2018 the average number of fire-related fatalities per year is 1. The highest number of deaths - 4 took place in 2008, and the lowest - 0 in 2002. The data has a growing trend.
The average number of fatalities per 1,000 fires is 2. This indicator was the highest - 9 in 2012, and the lowest 0 in 2002. The trend for deaths per 1,000 fire incidents is rising. Compared to the Virginia value the number of deaths per 1,000 incidents is similar.
According to the reports from the years 2002 - 2018 the average number of fire-related fatalities per year is 1. The highest number of deaths - 4 took place in 2008, and the lowest - 0 in 2002. The data has a growing trend.
The average number of fatalities per 1,000 fires is 2. This indicator was the highest - 9 in 2012, and the lowest 0 in 2002. The trend for deaths per 1,000 fire incidents is rising. Compared to the Virginia value the number of deaths per 1,000 incidents is similar.Deaths per 1,000 incidents in Hampton, VA compared to nearest cities:
(Note: Based on data for all years, including only cities with at least 2,500 fire incidents)
| Hampton: | 2.5 |
| Newport News: | 2.1 |
| Norfolk: | 1.0 |
| Portsmouth: | 2.1 |
| Chesapeake: | 2.6 |
| Virginia Beach: | 3.1 |
| Suffolk: | 1.7 |
| Williamsburg: | 2.2 |
| Elizabeth City: | 0.4 |
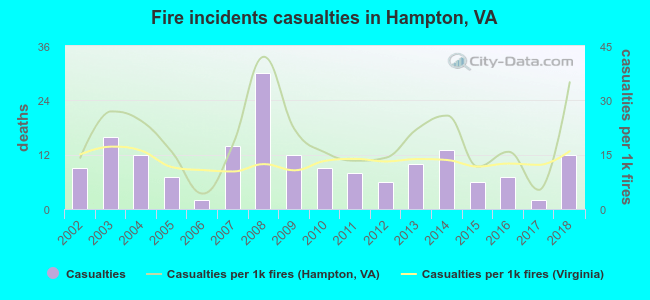 Based on the reports from the years 2002 - 2018 the average number of fire-related casualties per year is 10. The highest number of reported casualties - 30 took place in 2008, and the lowest - 2 in 2006. The data has an increasing trend.
The average number of injuries per 1,000 fires is 19. This indicator was the highest - 42 in 2008, and the lowest 4 in 2006. The trend for casualties per 1,000 fires is increasing. Compared to the state value the number of injuries per 1,000 fires is higher.
Based on the reports from the years 2002 - 2018 the average number of fire-related casualties per year is 10. The highest number of reported casualties - 30 took place in 2008, and the lowest - 2 in 2006. The data has an increasing trend.
The average number of injuries per 1,000 fires is 19. This indicator was the highest - 42 in 2008, and the lowest 4 in 2006. The trend for casualties per 1,000 fires is increasing. Compared to the state value the number of injuries per 1,000 fires is higher.Casualties per 1,000 incidents in Hampton, VA compared to nearest cities:
(Note: Based on data for all years, including only cities with at least 500 fire incidents)
| Hampton: | 19.6 |
| Poquoson: | 17.4 |
| Newport News: | 39.0 |
| Norfolk: | 9.0 |
| Portsmouth: | 3.9 |
| Smithfield: | 4.9 |
| Yorktown: | 22.7 |
| Chesapeake: | 37.9 |
| Virginia Beach: | 41.3 |
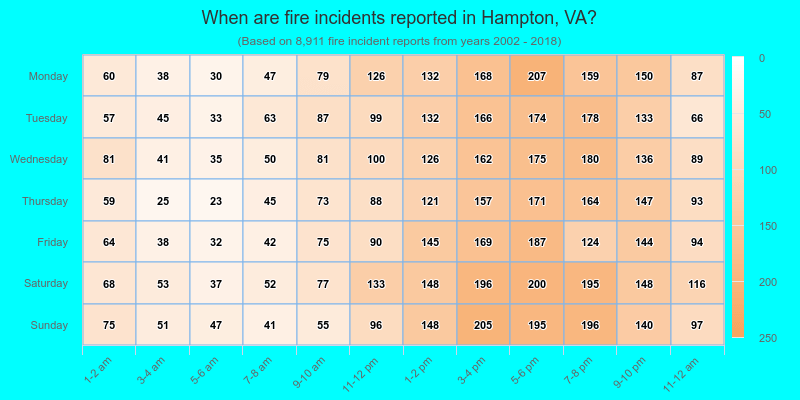
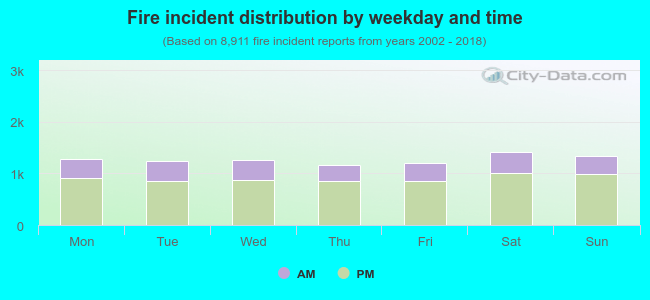 29.1% incidents where reported in the morning and 70.9% in the evening. The most fires (16.0%) took place on Saturday, and the least (13.1%) on Thursday.
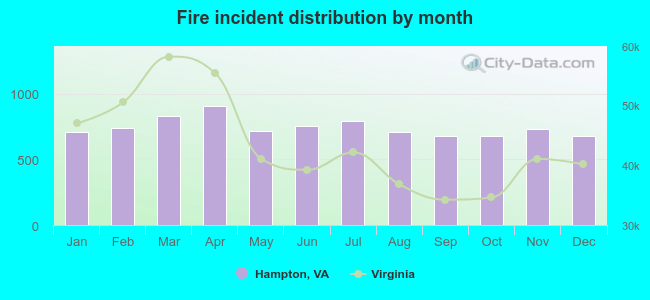 Based on the 8,911 fire incident reports from years 2002 - 2018 most fires (10.2%) took place during April, and the least (7.6%) in September.
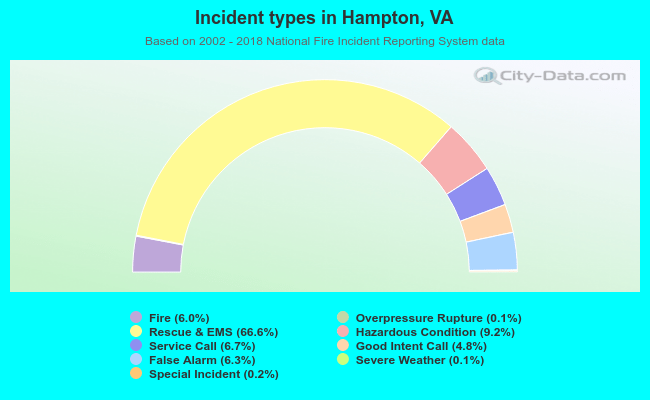 Out of all 148,412 cases reported during the years 2002 - 2018, the most belonged to the categories: Rescue & EMS (66.6%), Hazardous Condition (9.2%), and Service Call (6.7%).
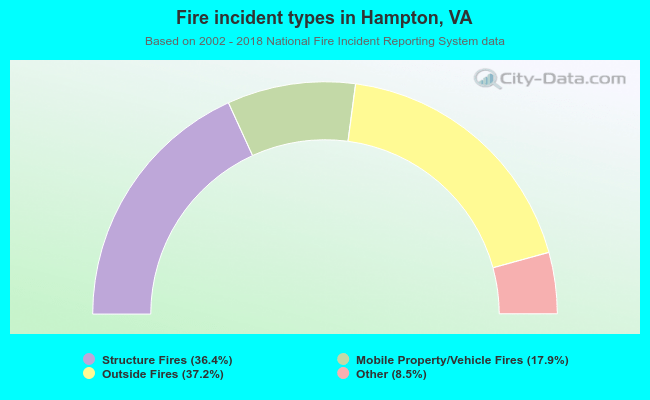 When looking into fire subcategories, the most incidents belonged to: Outside Fires (37.2%), and Structure Fires (36.4%).