Suffolk: Fire Incidents, Virginia (VA)
Where are fire incidents reported in Suffolk, VA
Something went wrong! Please refresh the page.
| Fire incidents reported | |
|---|---|
| Sreet name | Count |
| MAIN ST | 468 |
| WASHINGTON ST | 364 |
| HOLLAND RD | 344 |
| GODWIN BLVD | 290 |
| NANSEMOND PKWY | 272 |
| RT 58 | 236 |
| BRIDGE RD | 212 |
| CAROLINA RD | 206 |
| WHALEYVILLE BLVD | 196 |
| PORTSMOUTH BLVD | 190 |
| CONSTANCE RD | 184 |
| COLLEGE DR | 168 |
| PRUDEN BLVD | 144 |
| WILROY RD | 138 |
| QUAY RD | 128 |
| WHITE MARSH RD | 118 |
| PUGHSVILLE RD | 102 |
| MANNING RD | 100 |
| SLEEPY HOLE RD | 98 |
| INTERSTATE 664 | 94 |
| BROOK AVE | 88 |
| NANCY DR | 86 |
| CRITTENDEN RD | 84 |
| STACEY DR | 82 |
| TOWNPOINT RD | 80 |
| HARBOUR VIEW BLVD | 78 |
| HOSIER RD | 78 |
| BENNETTS PASTURE RD | 76 |
| COPELAND RD | 74 |
| BROAD ST | 72 |
| Other | 2,396 |
2002 - 2018 National Fire Incident Reporting System (NFIRS) incidents
- Incident types reported to NFIRS in Suffolk, VA
- 37,02058.0%Rescue & EMS
- 7,24611.3%Fire
- 6,37210.0%Hazardous Condition
- 4,3116.8%Service Call
- 3,7835.9%False Alarm
- 3,0284.7%Good Intent Call
- 1,8582.9%Special Incident
- 1160.2%Severe Weather
- 1120.2%Overpressure Rupture
- Fire incident types reported to NFIRS in Suffolk, VA
- 2,89139.9%Outside Fires
- 2,81938.9%Structure Fires
- 1,33418.4%Mobile Property/Vehicle Fires
- 2022.8%Other
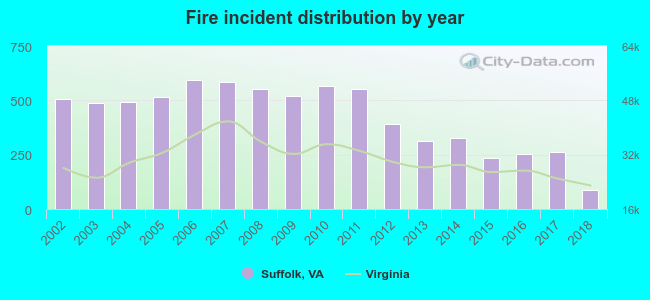 According to the data from the years 2002 - 2018 the average number of fires per year is 426. The highest number of fires - 593 took place in 2006, and the least - 89 in 2018. The data has a declining trend.
The average number of yearly fire incidents per 10k residents in Suffolk, VA compared to nearest cities:
(Note: Based on data for the last 3 years, including only cities with population 5,000 and above)
| Suffolk: | 23.3 |
| Portsmouth: | 39.2 |
| Smithfield: | 57.1 |
| Chesapeake: | 18.5 |
| Franklin: | 109.5 |
| Brambleton: | 3.6 |
| Meadowbrook: | 8.5 |
| Norfolk: | 30.1 |
| Newport News: | 28.0 |
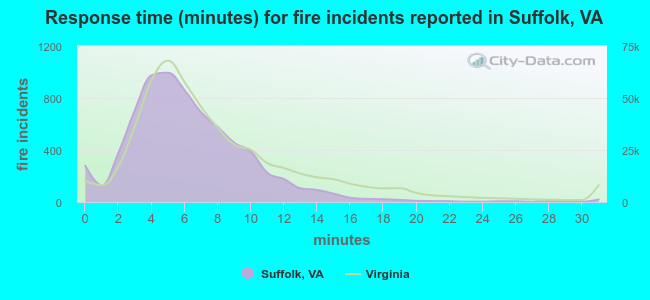 The median response time based on all reported fire incidents is 6 minutes. This is close to the state median value.
The median response time in Suffolk, VA compared to nearest cities:
(Note: Based on data for all years, including only cities with at least 500 fire incidents)
| Suffolk: | 6 minutes |
| Portsmouth: | 5 minutes |
| Smithfield: | 7 minutes |
| Chesapeake: | 7 minutes |
| Franklin: | 7 minutes |
| Norfolk: | 4 minutes |
| Newport News: | 5 minutes |
| Hampton: | 5 minutes |
| Courtland: | 11 minutes |
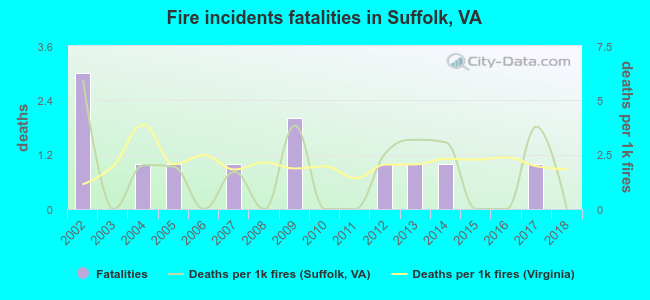 According to the reports from the years 2002 - 2018 the average number of fire-related yearly deaths is 1. The highest number of deaths - 3 took place in 2002, and the lowest - 0 in 2003. The data has a declining trend.
The average number of fatalities per 1,000 fire incidents is 2. This indicator was the highest - 6 in 2002, and the lowest 0 in 2003. The trend for deaths per 1,000 incidents is decreasing. Compared to the Virginia value the number of deaths per 1,000 fires is lower.
According to the reports from the years 2002 - 2018 the average number of fire-related yearly deaths is 1. The highest number of deaths - 3 took place in 2002, and the lowest - 0 in 2003. The data has a declining trend.
The average number of fatalities per 1,000 fire incidents is 2. This indicator was the highest - 6 in 2002, and the lowest 0 in 2003. The trend for deaths per 1,000 incidents is decreasing. Compared to the Virginia value the number of deaths per 1,000 fires is lower.Deaths per 1,000 incidents in Suffolk, VA compared to nearest cities:
(Note: Based on data for all years, including only cities with at least 2,500 fire incidents)
| Suffolk: | 1.7 |
| Portsmouth: | 2.1 |
| Chesapeake: | 2.6 |
| Norfolk: | 1.0 |
| Newport News: | 2.1 |
| Hampton: | 2.5 |
| Virginia Beach: | 3.1 |
| Williamsburg: | 2.2 |
| Elizabeth City: | 0.4 |
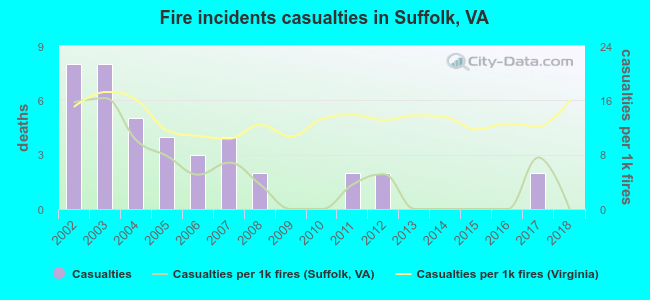 Based on the data from the years 2002 - 2018 the average number of fire-related yearly casualties is 2. The highest number of reported casualties - 8 took place in 2002, and the lowest - 0 in 2009. The data has a declining trend.
The average number of casualties per 1,000 fires is 5. This indicator was the highest - 16 in 2003, and the lowest 0 in 2009. The trend for injuries per 1,000 incidents is declining. Compared to the state value the number of casualties per 1,000 fire incidents is much lower.
Based on the data from the years 2002 - 2018 the average number of fire-related yearly casualties is 2. The highest number of reported casualties - 8 took place in 2002, and the lowest - 0 in 2009. The data has a declining trend.
The average number of casualties per 1,000 fires is 5. This indicator was the highest - 16 in 2003, and the lowest 0 in 2009. The trend for injuries per 1,000 incidents is declining. Compared to the state value the number of casualties per 1,000 fire incidents is much lower.Casualties per 1,000 incidents in Suffolk, VA compared to nearest cities:
(Note: Based on data for all years, including only cities with at least 500 fire incidents)
| Suffolk: | 5.5 |
| Portsmouth: | 3.9 |
| Smithfield: | 4.9 |
| Chesapeake: | 37.9 |
| Franklin: | 6.1 |
| Norfolk: | 9.0 |
| Newport News: | 39.0 |
| Hampton: | 19.6 |
| Courtland: | 0.0 |
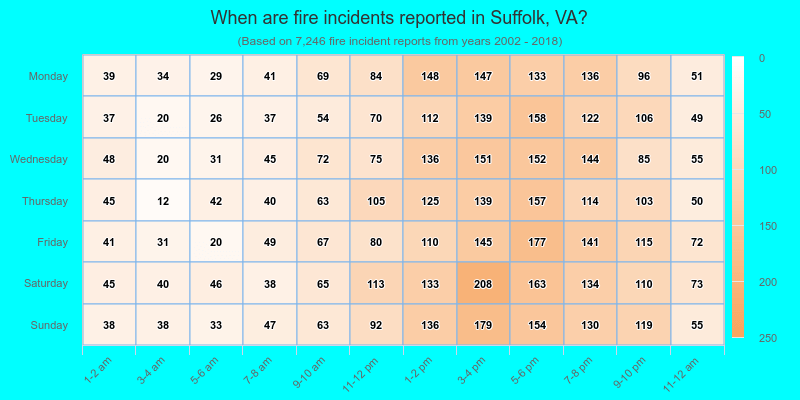
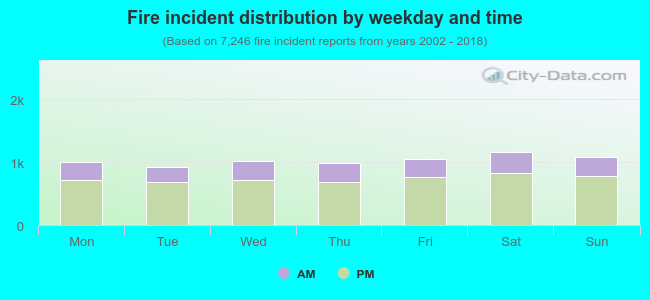 28.8% incidents where reported in the morning and 71.2% in the evening. The most fires (16.1%) took place on Saturday, and the least (12.8%) on Tuesday.
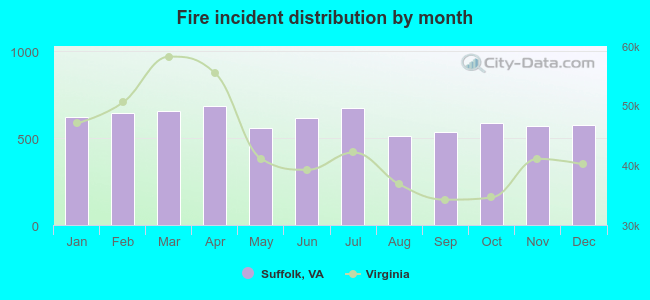 Based on the 7,246 fire incident reports from years 2002 - 2018 most fires (9.5%) took place during April, and the least (7.1%) in August.
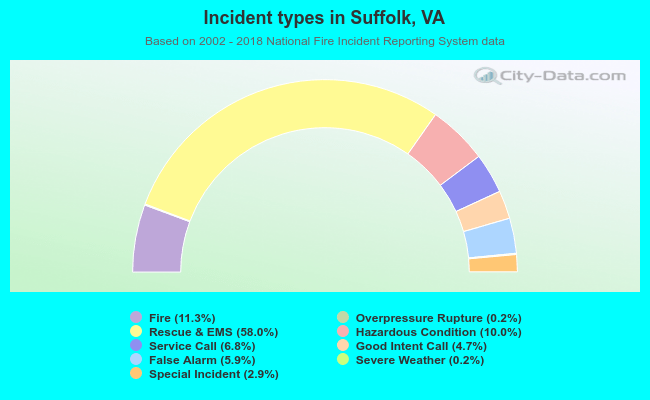 Out of all 63,846 cases reported during the years 2002 - 2018, the most belonged to the categories: Rescue & EMS (58.0%), Fire (11.3%), and Hazardous Condition (10.0%).
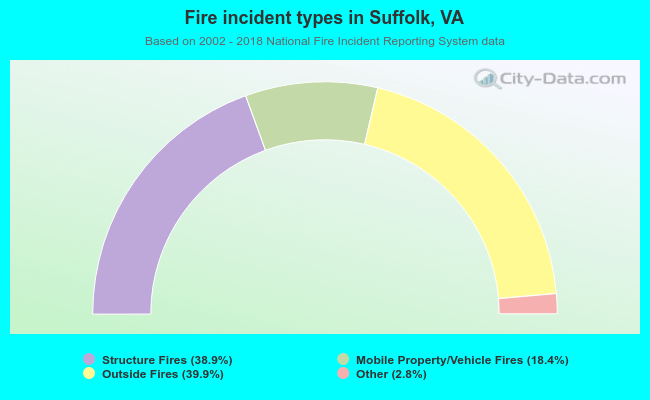 When looking into fire subcategories, the most incidents belonged to: Outside Fires (39.9%), and Structure Fires (38.9%).