Crete: Fire Incidents, Illinois (IL)
Where are fire incidents reported in Crete, IL
Something went wrong! Please refresh the page.
| Fire incidents reported | |
|---|---|
| Sreet name | Count |
| RICHTON RD | 128 |
| EXCHANGE ST | 126 |
| DIXIE HWY | 116 |
| MAIN ST | 94 |
| STEGER RD | 76 |
| MAIN | 62 |
| EXCHANGE | 54 |
| GOODENOW RD | 54 |
| BURVILLE RD | 52 |
| KLEMME RD | 44 |
| KINGS RD | 40 |
| OLD MONEE RD | 40 |
| VOLBRECHT RD | 38 |
| BEMES RD | 34 |
| STATE ST | 30 |
| COTTAGE GROVE | 28 |
| RONALD RD | 28 |
| STATE LINE RD | 28 |
| TORRENCE AVE | 26 |
| NEW MONEE RD | 24 |
| RT 394 | 24 |
| DANNE RD | 22 |
| EAGLE NEST DR | 22 |
| STATELINE RD | 22 |
| STONEY ISLAND AVE | 22 |
| VINCENNES ST | 22 |
| ARLINGTON LN | 20 |
| ASHLAND AVE | 18 |
| COTTAGE GROVE AVE | 18 |
| FIRST ST | 18 |
| Other | 291 |
2002 - 2018 National Fire Incident Reporting System (NFIRS) incidents
- Incident types reported to NFIRS in Crete, IL
- 8,02160.0%Rescue & EMS
- 1,62112.1%Fire
- 1,0728.0%Hazardous Condition
- 9427.0%False Alarm
- 8786.6%Service Call
- 7735.8%Good Intent Call
- 370.3%Special Incident
- 160.1%Severe Weather
- Fire incident types reported to NFIRS in Crete, IL
- 87353.9%Structure Fires
- 42526.2%Outside Fires
- 20612.7%Mobile Property/Vehicle Fires
- 1177.2%Other
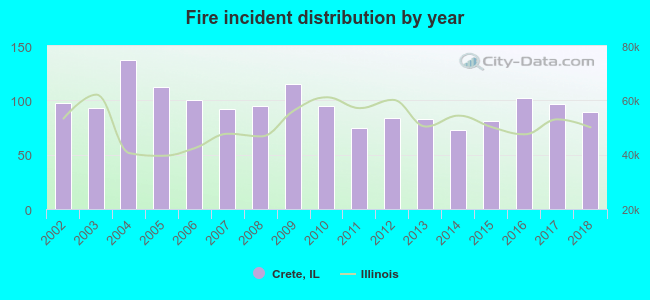 According to the data from the years 2002 - 2018 the average number of fire incidents per year is 95. The highest number of reported fires - 137 took place in 2004, and the least - 73 in 2014. The data has a decreasing trend.
The average number of yearly fire incidents per 10k residents in Crete, IL compared to nearest cities:
(Note: Based on data for the last 3 years, including only cities with population 5,000 and above)
| Crete: | 116.7 |
| Steger: | 37.3 |
| Sauk Village: | 61.3 |
| Park Forest: | 45.2 |
| Chicago Heights: | 29.5 |
| University Park: | 72.8 |
| Olympia Fields: | 19.8 |
| Richton Park: | 46.3 |
| Lynwood: | 23.3 |
 The median response time based on all reported fire incidents is 6 minutes. This is comparable to the state median value.
The median response time in Crete, IL compared to nearest cities:
(Note: Based on data for all years, including only cities with at least 500 fire incidents)
| Crete: | 6 minutes |
| Steger: | 5 minutes |
| Sauk Village: | 8 minutes |
| Park Forest: | 5 minutes |
| Chicago Heights: | 4 minutes |
| University Park: | 6 minutes |
| Richton Park: | 6 minutes |
| Glenwood: | 5 minutes |
| Flossmoor: | 6 minutes |
 Based on the data from the years 2002 - 2018 the average number of fire-related fatalities per year is 0. The highest number of deaths - 1 took place in 2007, and the lowest - 0 in 2002. The data has a constant trend.
 According to the reports from the years 2002 - 2018 the average number of fire-related yearly casualties is 0. The highest number of casualties - 3 took place in 2015, and the lowest - 0 in 2003. The data has a dropping trend.
The average number of injuries per 1,000 fire incidents is 4. This indicator was the highest - 37 in 2015, and the lowest 0 in 2003. The trend for casualties per 1,000 incidents is declining. Compared to the state value the number of casualties per 1,000 incidents is much lower.
According to the reports from the years 2002 - 2018 the average number of fire-related yearly casualties is 0. The highest number of casualties - 3 took place in 2015, and the lowest - 0 in 2003. The data has a dropping trend.
The average number of injuries per 1,000 fire incidents is 4. This indicator was the highest - 37 in 2015, and the lowest 0 in 2003. The trend for casualties per 1,000 incidents is declining. Compared to the state value the number of casualties per 1,000 incidents is much lower.Casualties per 1,000 incidents in Crete, IL compared to nearest cities:
(Note: Based on data for all years, including only cities with at least 500 fire incidents)
| Crete: | 4.3 |
| Steger: | 6.8 |
| Sauk Village: | 5.5 |
| Park Forest: | 37.5 |
| Chicago Heights: | 9.6 |
| University Park: | 8.1 |
| Richton Park: | 6.1 |
| Glenwood: | 3.1 |
| Flossmoor: | 17.8 |
 30.4% incidents where reported in the morning and 69.6% in the evening. The most fires (17.3%) took place on Saturday, and the least (11.7%) on Tuesday.
 Based on the 1,621 fires from years 2002 - 2018 most fires (11.8%) took place during April, and the least (5.9%) in May.
 Out of all 13,366 cases reported during the years 2002 - 2018, the most belonged to the categories: Rescue & EMS (60.0%), Fire (12.1%), and Hazardous Condition (8.0%).
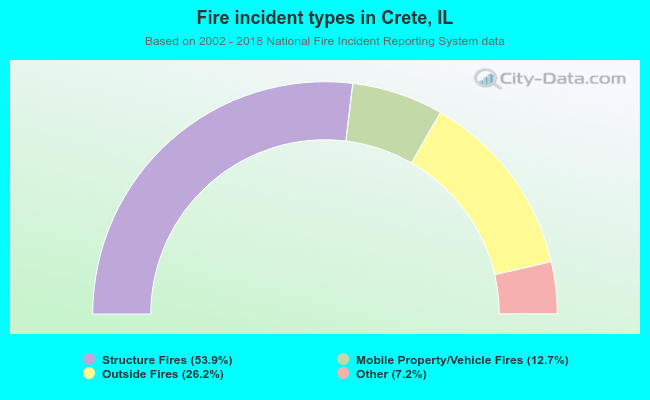 When looking into fire subcategories, the most reports belonged to: Structure Fires (53.9%), and Outside Fires (26.2%).