Lynwood: Fire Incidents, Illinois (IL)
Where are fire incidents reported in Lynwood, IL
Something went wrong! Please refresh the page.
|
| |||||||||||||||||||||||||||||||||||||||||||||||||||||||||||||||||||||||||||||||||||||||||||||||||||||||||||||
2002 - 2018 National Fire Incident Reporting System (NFIRS) incidents
- Incident types reported to NFIRS in Lynwood, IL
- 1,11550.8%Rescue & EMS
- 45520.7%Fire
- 25811.7%Good Intent Call
- 1557.1%Service Call
- 1024.6%False Alarm
- 1004.6%Hazardous Condition
- 90.4%Special Incident
- Fire incident types reported to NFIRS in Lynwood, IL
- 38284.0%Structure Fires
- 306.6%Mobile Property/Vehicle Fires
- 255.5%Other
- 184.0%Outside Fires
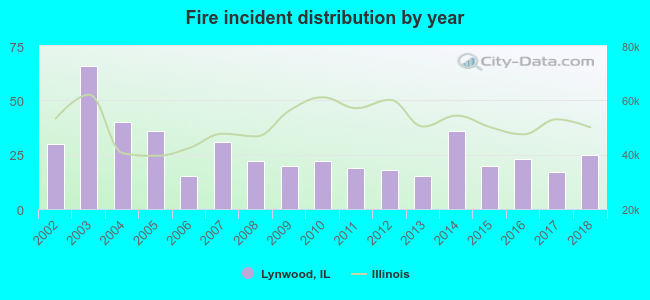 According to the data from the years 2002 - 2018 the average number of fire incidents per year is 27. The highest number of fires - 66 took place in 2003, and the least - 15 in 2006. The data has a dropping trend.
The average number of yearly fire incidents per 10k residents in Lynwood, IL compared to nearest cities:
(Note: Based on data for the last 3 years, including only cities with population 5,000 and above)
| Lynwood: | 23.3 |
| Lansing: | 37.2 |
| Sauk Village: | 61.3 |
| Glenwood: | 46.1 |
| Chicago Heights: | 29.5 |
| South Holland: | 57.7 |
| Steger: | 37.3 |
| Calumet City: | 61.8 |
| Crete: | 116.7 |
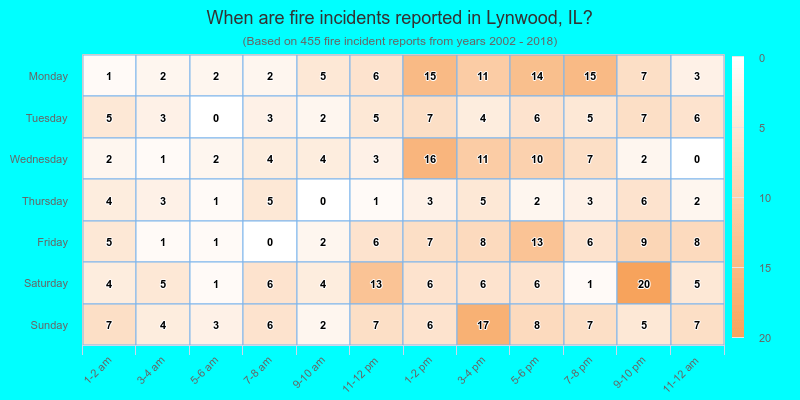
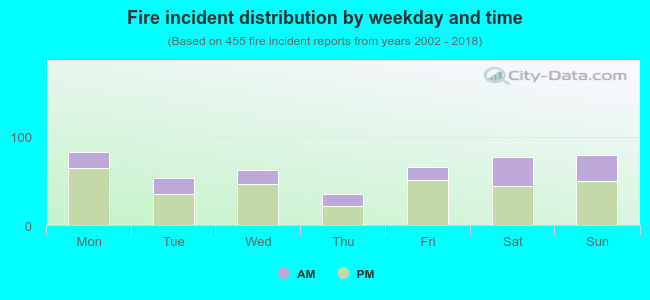 31.4% incidents where reported in the morning and 68.6% in the evening. The most fires (18.2%) took place on Monday, and the least (7.7%) on Thursday.
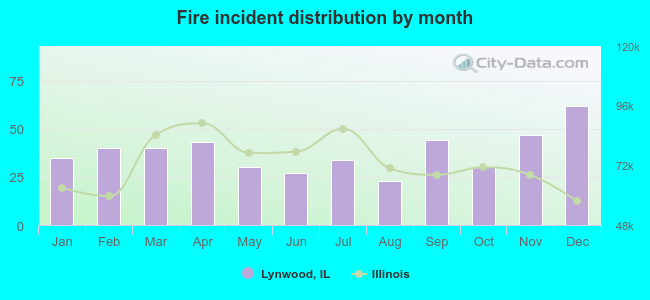 Based on the 455 incident reports from years 2002 - 2018 most fires (13.6%) took place during December, and the least (5.1%) in August.
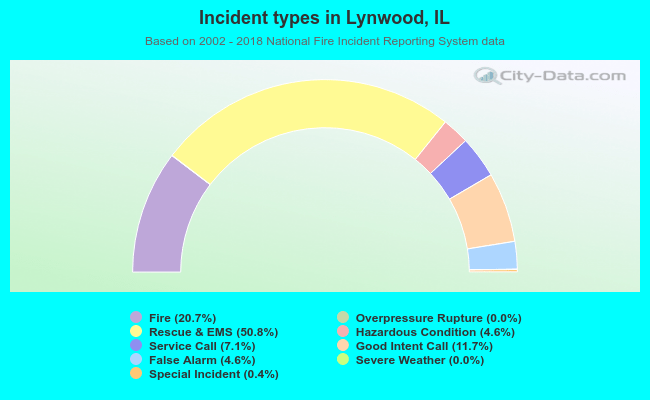 Out of all 2,196 cases reported during the years 2002 - 2018, the most belonged to the categories: Rescue & EMS (50.8%), Fire (20.7%), and Good Intent Call (11.7%).
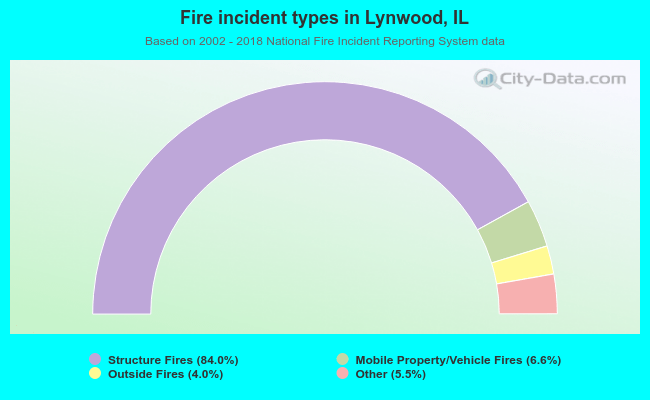 When looking into fire subcategories, the most incidents belonged to: Structure Fires (84.0%), and Mobile Property/Vehicle Fires (6.6%).