Hobart: Fire Incidents, Indiana (IN)
Where are fire incidents reported in Hobart, IN
Something went wrong! Please refresh the page.
| Fire incidents reported | |
|---|---|
| Sreet name | Count |
| 37TH AVE | 120 |
| COLORADO ST | 34 |
| OLD RIDGE RD | 34 |
| LAKE PARK AVE | 32 |
| SOUTHLAKE MALL | 32 |
| 37TH AVE | 28 |
| COUNTY LINE RD | 24 |
| UNION ST | 24 |
| 10TH ST | 22 |
| 37TH | 18 |
| 49TH AVE | 18 |
| GRAND BLVD | 18 |
| HOBART RD | 18 |
| MAIN ST | 18 |
| RIDGE RD | 18 |
| 3RD ST | 16 |
| LAKE ST | 16 |
| LIVERPOOL | 16 |
| WISCONSIN ST | 16 |
| 2ND ST | 14 |
| 37TH AV | 14 |
| 61ST AVE | 14 |
| 8TH ST | 14 |
| GRAND BLVD | 14 |
| LAKE PARK AVE | 14 |
| OLD RIDGE RD | 14 |
| 3RD | 12 |
| 61ST AVE | 12 |
| 80TH AVE | 12 |
| ALABAMA ST | 12 |
| Other | 623 |
2002 - 2017 National Fire Incident Reporting System (NFIRS) incidents
- Incident types reported to NFIRS in Hobart, IN
- 1,76438.9%Rescue & EMS
- 1,29128.5%Fire
- 83918.5%Hazardous Condition
- 2164.8%Service Call
- 2054.5%False Alarm
- 1914.2%Good Intent Call
- 140.3%Special Incident
- 50.1%Overpressure Rupture
- 50.1%Severe Weather
- Fire incident types reported to NFIRS in Hobart, IN
- 57744.7%Outside Fires
- 35827.7%Structure Fires
- 27321.1%Mobile Property/Vehicle Fires
- 836.4%Other
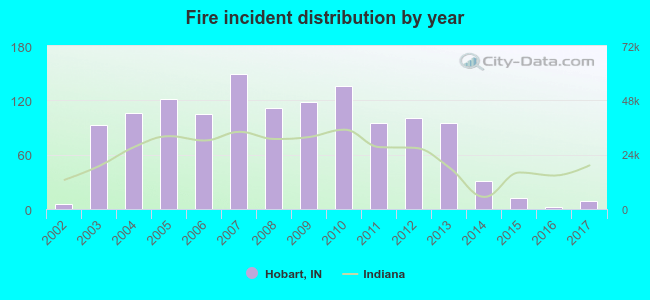 Based on the data from the years 2002 - 2017 the average number of fire incidents per year is 81. The highest number of reported fires - 149 took place in 2007, and the least - 2 in 2016. The data has an increasing trend.
The average number of yearly fire incidents per 10k residents in Hobart, IN compared to nearest cities:
(Note: Based on data for the last 3 years, including only cities with population 5,000 and above)
| Hobart: | 1.4 |
| Lake Station: | 22.2 |
| Merrillville: | 23.5 |
| Gary: | 11.3 |
| Portage: | 16.1 |
| South Haven: | 8.5 |
| Griffith: | 3.6 |
| Crown Point: | 18.9 |
| Schererville: | 13.3 |
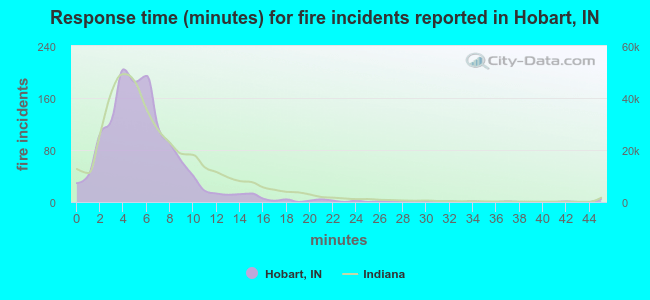 The median response time based on all reported fire incidents is 5 minutes. This is lower than the state median value.
The median response time in Hobart, IN compared to nearest cities:
(Note: Based on data for all years, including only cities with at least 500 fire incidents)
| Hobart: | 5 minutes |
| Lake Station: | 7 minutes |
| Merrillville: | 5 minutes |
| Gary: | 5 minutes |
| Portage: | 6 minutes |
| Crown Point: | 6 minutes |
| Schererville: | 7 minutes |
| Highland: | 7 minutes |
| Valparaiso: | 6 minutes |
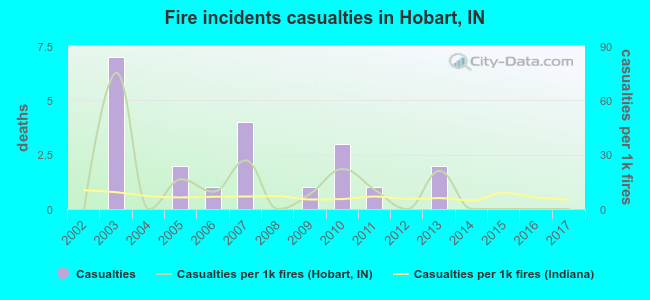 According to the data from the years 2002 - 2017 the average number of fire-related casualties per year is 1. The highest number of casualties - 7 took place in 2003, and the lowest - 0 in 2002. The data has a constant trend.
The average number of casualties per 1,000 fires is 12. This indicator was the highest - 75 in 2003, and the lowest 0 in 2002. The trend for casualties per 1,000 fire incidents is declining. Compared to the state value the number of casualties per 1,000 fire incidents is much higher.
According to the data from the years 2002 - 2017 the average number of fire-related casualties per year is 1. The highest number of casualties - 7 took place in 2003, and the lowest - 0 in 2002. The data has a constant trend.
The average number of casualties per 1,000 fires is 12. This indicator was the highest - 75 in 2003, and the lowest 0 in 2002. The trend for casualties per 1,000 fire incidents is declining. Compared to the state value the number of casualties per 1,000 fire incidents is much higher.Casualties per 1,000 incidents in Hobart, IN compared to nearest cities:
(Note: Based on data for all years, including only cities with at least 500 fire incidents)
| Hobart: | 16.3 |
| Lake Station: | 1.9 |
| Merrillville: | 6.6 |
| Gary: | 2.4 |
| Portage: | 12.3 |
| Crown Point: | 1.4 |
| Schererville: | 3.9 |
| Highland: | 4.2 |
| Valparaiso: | 5.0 |
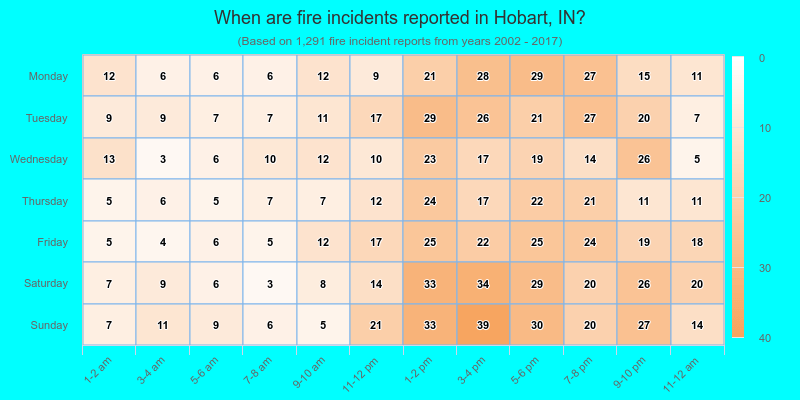
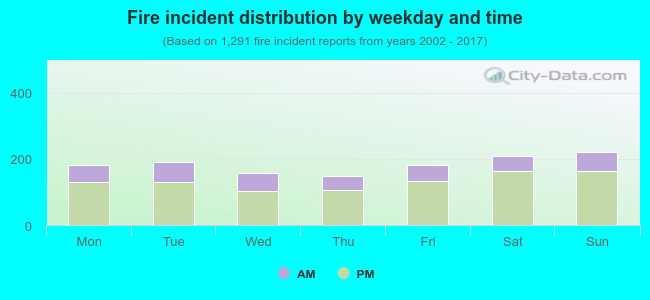 28.0% incidents where reported in the morning and 72.0% in the evening. The most fires (17.2%) took place on Sunday, and the least (11.5%) on Thursday.
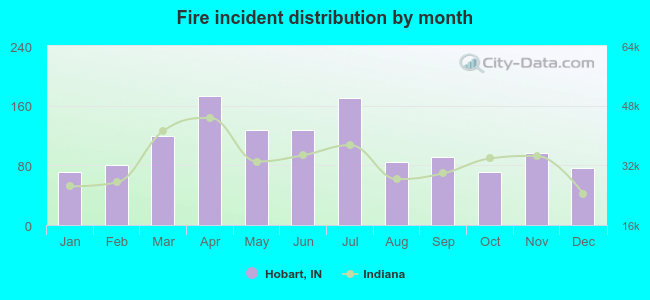 Based on the 1,291 incident reports from years 2002 - 2017 most fires (13.4%) took place during April, and the least (5.5%) in January.
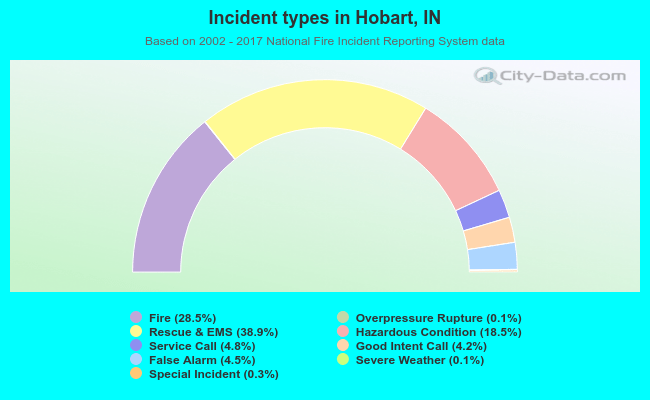 Out of all 4,530 cases reported during the years 2002 - 2017, the most belonged to the categories: Rescue & EMS (38.9%), Fire (28.5%), and Hazardous Condition (18.5%).
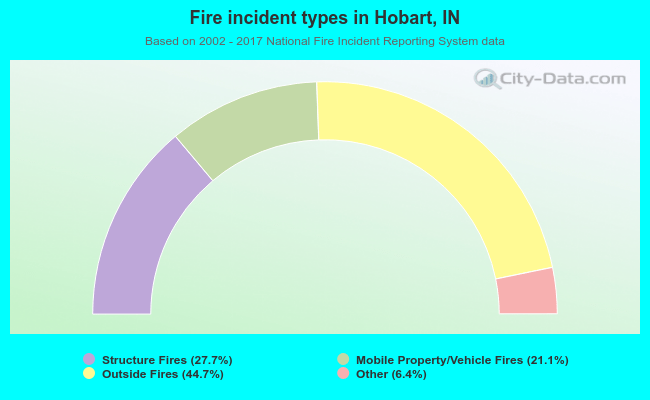 When looking into fire subcategories, the most incidents belonged to: Outside Fires (44.7%), and Structure Fires (27.7%).