Highland: Fire Incidents, Indiana (IN)
Where are fire incidents reported in Highland, IN
Something went wrong! Please refresh the page.
| Fire incidents reported | |
|---|---|
| Sreet name | Count |
| INDIANAPOLIS BLVD | 206 |
| KENNEDY AVE | 84 |
| RIDGE RD | 64 |
| HIGHWAY AVE | 60 |
| CLINE AVE | 44 |
| 45TH ST | 40 |
| FARMER DR | 22 |
| GRAND BLVD | 22 |
| HAMPTON DR | 22 |
| 43RD ST | 20 |
| LINCOLN ST | 20 |
| PRAIRIE AVE | 20 |
| STRONG ST | 20 |
| MARTHA ST | 18 |
| PARKWAY DR | 18 |
| PARRISH AVE | 18 |
| FRANKLIN ST | 16 |
| GARFIELD AVE | 16 |
| GORDON DR | 16 |
| SYCAMORE AVE | 16 |
| WICKER AVE | 16 |
| BLUEBIRD LANE | 14 |
| DULUTH ST | 14 |
| ERIE ST | 14 |
| GRACE ST | 14 |
| JEWETT ST | 14 |
| SPRING ST | 14 |
| 100TH ST | 12 |
| EDER ST | 12 |
| LIABLE RD | 12 |
2003 - 2018 National Fire Incident Reporting System (NFIRS) incidents
- Incident types reported to NFIRS in Highland, IN
- 1,01837.3%Hazardous Condition
- 70625.9%Fire
- 48117.6%Rescue & EMS
- 2699.9%False Alarm
- 1204.4%Service Call
- 983.6%Good Intent Call
- 220.8%Special Incident
- 110.4%Severe Weather
- 40.1%Overpressure Rupture
- Fire incident types reported to NFIRS in Highland, IN
- 27038.2%Outside Fires
- 26036.8%Structure Fires
- 14019.8%Mobile Property/Vehicle Fires
- 365.1%Other
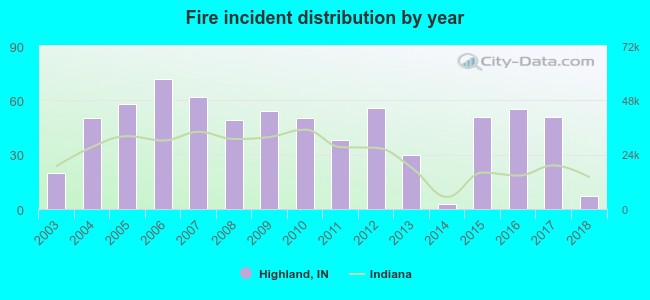 Based on the data from the years 2003 - 2018 the average number of fire incidents per year is 44. The highest number of reported fires - 72 took place in 2006, and the least - 3 in 2014. The data has a decreasing trend.
The average number of yearly fire incidents per 10k residents in Highland, IN compared to nearest cities:
(Note: Based on data for the last 3 years, including only cities with population 5,000 and above)
| Highland: | 16.3 |
| Griffith: | 3.6 |
| Munster: | 15.9 |
| Schererville: | 13.3 |
| Dyer: | 18.9 |
| Hammond: | 0.1 |
| East Chicago: | 61.9 |
| Gary: | 11.3 |
| Merrillville: | 23.5 |
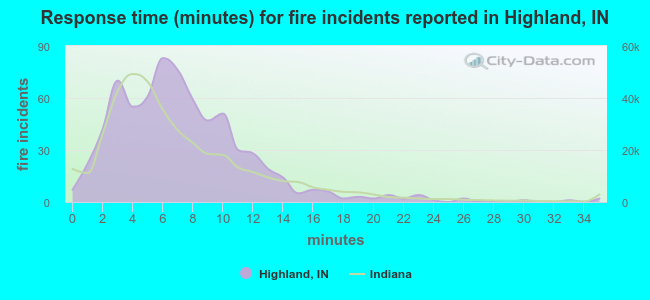 The median response time based on all reported fire incidents is 7 minutes. This is similar to the state median value.
The median response time in Highland, IN compared to nearest cities:
(Note: Based on data for all years, including only cities with at least 500 fire incidents)
| Highland: | 7 minutes |
| Munster: | 6 minutes |
| Schererville: | 7 minutes |
| Dyer: | 7 minutes |
| Hammond: | 4 minutes |
| Lansing: | 3 minutes |
| East Chicago: | 3 minutes |
| Gary: | 5 minutes |
| Calumet City: | 5 minutes |
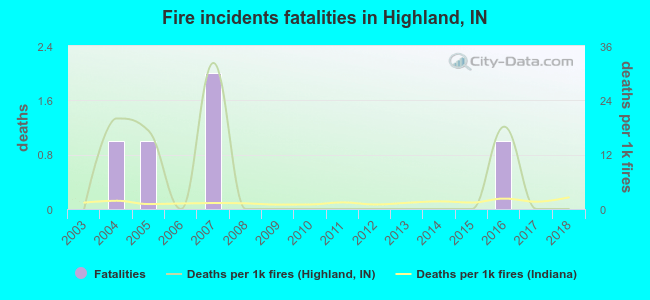 According to the data from the years 2003 - 2018 the average number of fire-related fatalities per year is 0. The highest number of deaths - 2 took place in 2007, and the lowest - 0 in 2003. The data has a constant trend.
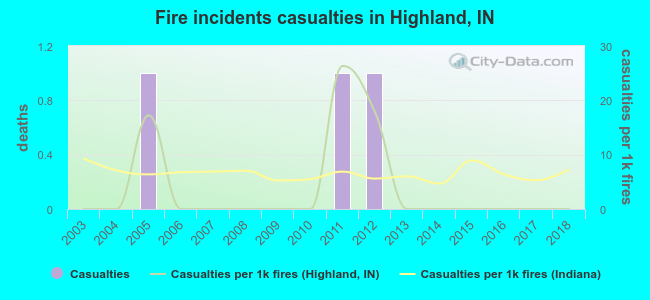 According to the reports from the years 2003 - 2018 the average number of fire-related casualties per year is 0. The highest number of injuries - 1 took place in 2005, and the lowest - 0 in 2003. The data has a constant trend.
The average number of injuries per 1,000 fires is 4. This indicator was the highest - 26 in 2011, and the lowest 0 in 2003. The trend for casualties per 1,000 incidents is constant. Compared to the state value the number of injuries per 1,000 incidents is lower.
According to the reports from the years 2003 - 2018 the average number of fire-related casualties per year is 0. The highest number of injuries - 1 took place in 2005, and the lowest - 0 in 2003. The data has a constant trend.
The average number of injuries per 1,000 fires is 4. This indicator was the highest - 26 in 2011, and the lowest 0 in 2003. The trend for casualties per 1,000 incidents is constant. Compared to the state value the number of injuries per 1,000 incidents is lower.Casualties per 1,000 incidents in Highland, IN compared to nearest cities:
(Note: Based on data for all years, including only cities with at least 500 fire incidents)
| Highland: | 4.2 |
| Munster: | 5.2 |
| Schererville: | 3.9 |
| Dyer: | 9.6 |
| Hammond: | 0.7 |
| Lansing: | 9.6 |
| East Chicago: | 9.1 |
| Gary: | 2.4 |
| Calumet City: | 6.7 |
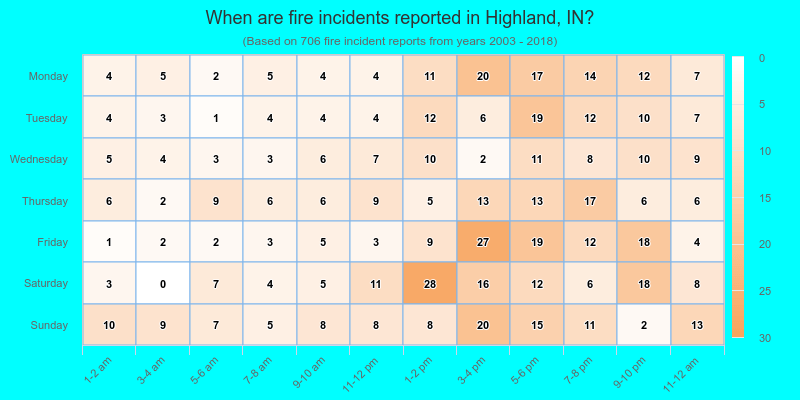
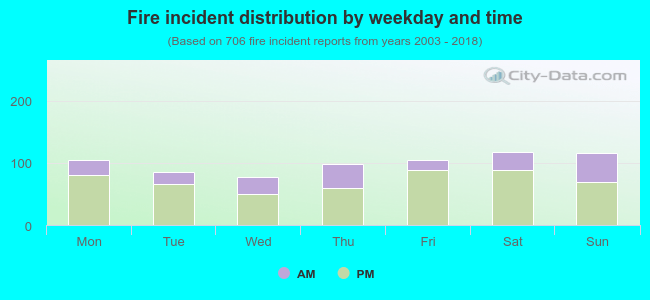 28.8% incidents where reported in the morning and 71.2% in the evening. The most fires (16.7%) took place on Saturday, and the least (11.0%) on Wednesday.
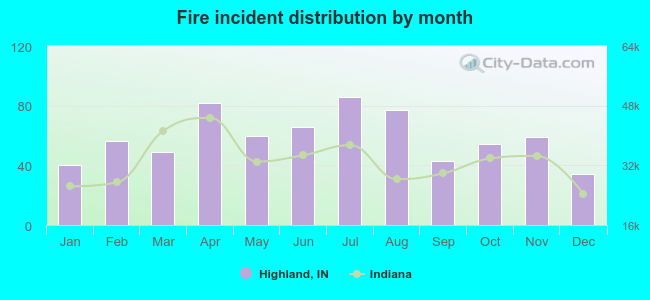 According to the 706 fire incidents from years 2003 - 2018 most fires (12.2%) took place during July, and the least (4.8%) in December.
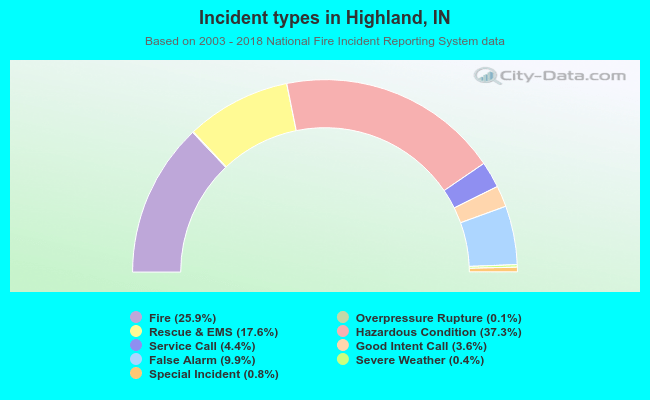 Out of all 2,729 cases reported during the years 2003 - 2018, the most belonged to the categories: Hazardous Condition (37.3%), Fire (25.9%), and Rescue & EMS (17.6%).
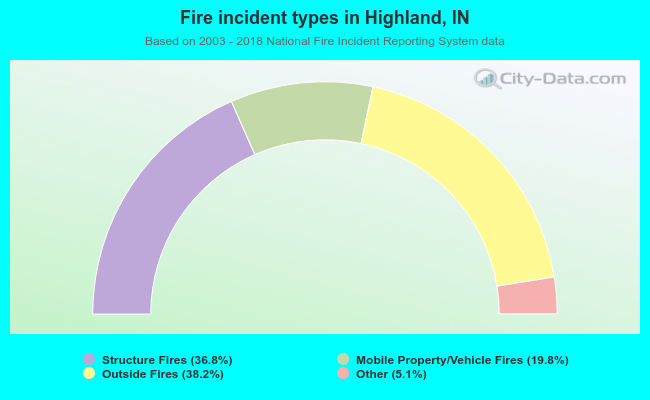 When looking into fire subcategories, the most reports belonged to: Outside Fires (38.2%), and Structure Fires (36.8%).