Merrillville: Fire Incidents, Indiana (IN)
Where are fire incidents reported in Merrillville, IN
Something went wrong! Please refresh the page.
| Fire incidents reported | |
|---|---|
| Sreet name | Count |
| BROADWAY | 56 |
| 52ND DR | 40 |
| US 30 | 34 |
| HAYES ST | 32 |
| 7900 GRANT ST | 26 |
| 73RD AVE | 22 |
| I-65 | 22 |
| TAFT ST | 20 |
| I65 | 18 |
| 57TH AVE | 16 |
| 61ST AVE | 16 |
| 84TH DR | 16 |
| LOUISIANA ST | 16 |
| 79TH AVE | 14 |
| 7250 ARTHUR BLVD | 12 |
| LINCOLN HWY | 12 |
| MISSISSIPPI ST | 12 |
| VAN BUREN ST | 12 |
| WHITCOMB ST | 12 |
| 58TH PL | 10 |
| 60TH DR | 10 |
| 6909 PENNSYLVANNIA ST. | 10 |
| 7110 BROADWAY | 10 |
| 79 PL | 10 |
| 79TH CT | 10 |
| 800 E. 81ST AVE. | 10 |
| 8050 MADISON ST | 10 |
| 80TH PL | 10 |
| 81ST AVE | 10 |
| 85TH AVE | 10 |
| Other | 1,299 |
2004 - 2017 National Fire Incident Reporting System (NFIRS) incidents
- Incident types reported to NFIRS in Merrillville, IN
- 2,20530.0%Rescue & EMS
- 1,81724.7%Fire
- 1,52120.7%Hazardous Condition
- 81111.0%Good Intent Call
- 6979.5%False Alarm
- 2703.7%Service Call
- 120.2%Special Incident
- 90.1%Overpressure Rupture
- Fire incident types reported to NFIRS in Merrillville, IN
- 87047.9%Structure Fires
- 51128.1%Outside Fires
- 37220.5%Mobile Property/Vehicle Fires
- 643.5%Other
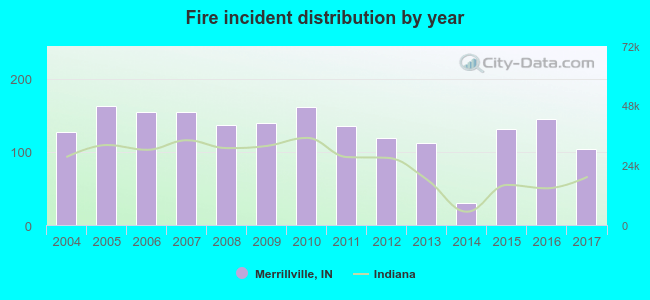 Based on the data from the years 2004 - 2017 the average number of fire incidents per year is 129. The highest number of reported fires - 163 took place in 2005, and the least - 30 in 2014. The data has a dropping trend.
The average number of yearly fire incidents per 10k residents in Merrillville, IN compared to nearest cities:
(Note: Based on data for the last 3 years, including only cities with population 5,000 and above)
| Merrillville: | 23.5 |
| Crown Point: | 18.9 |
| Hobart: | 1.4 |
| Schererville: | 13.3 |
| Griffith: | 3.6 |
| Gary: | 11.3 |
| Lake Station: | 22.2 |
| Highland: | 16.3 |
| Dyer: | 18.9 |
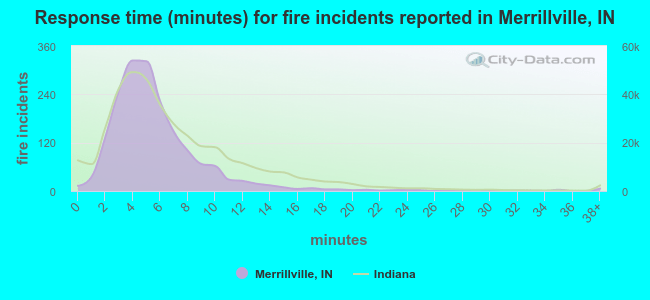 The median response time based on all reported fire incidents is 5 minutes. This is lower than the state median value.
The median response time in Merrillville, IN compared to nearest cities:
(Note: Based on data for all years, including only cities with at least 500 fire incidents)
| Merrillville: | 5 minutes |
| Crown Point: | 6 minutes |
| Hobart: | 5 minutes |
| Schererville: | 7 minutes |
| Gary: | 5 minutes |
| Lake Station: | 7 minutes |
| Highland: | 7 minutes |
| Dyer: | 7 minutes |
| Munster: | 6 minutes |
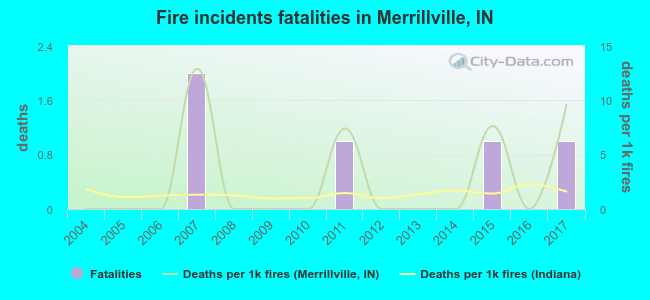 Based on the data from the years 2004 - 2017 the average number of fire-related fatalities per year is 0. The highest number of deaths - 2 took place in 2007, and the lowest - 0 in 2004. The data has an increasing trend.
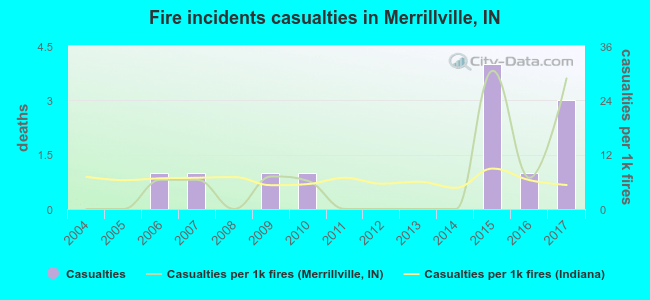 According to the data from the years 2004 - 2017 the average number of fire-related casualties per year is 1. The highest number of casualties - 4 took place in 2015, and the lowest - 0 in 2004. The data has a growing trend.
The average number of casualties per 1,000 fires is 7. This indicator was the highest - 31 in 2015, and the lowest 0 in 2004. The trend for injuries per 1,000 incidents is increasing. Compared to the state value the number of injuries per 1,000 incidents is similar.
According to the data from the years 2004 - 2017 the average number of fire-related casualties per year is 1. The highest number of casualties - 4 took place in 2015, and the lowest - 0 in 2004. The data has a growing trend.
The average number of casualties per 1,000 fires is 7. This indicator was the highest - 31 in 2015, and the lowest 0 in 2004. The trend for injuries per 1,000 incidents is increasing. Compared to the state value the number of injuries per 1,000 incidents is similar.Casualties per 1,000 incidents in Merrillville, IN compared to nearest cities:
(Note: Based on data for all years, including only cities with at least 500 fire incidents)
| Merrillville: | 6.6 |
| Crown Point: | 1.4 |
| Hobart: | 16.3 |
| Schererville: | 3.9 |
| Gary: | 2.4 |
| Lake Station: | 1.9 |
| Highland: | 4.2 |
| Dyer: | 9.6 |
| Munster: | 5.2 |
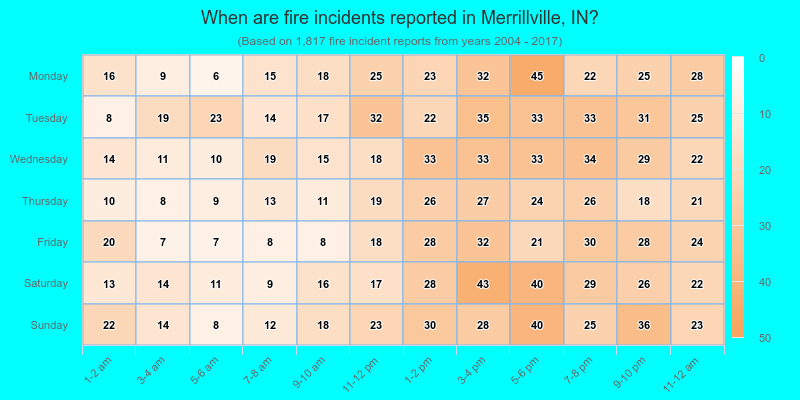
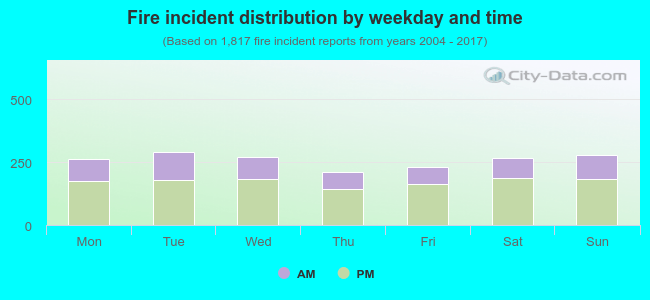 33.2% incidents where reported in the morning and 66.8% in the evening. The most fires (16.1%) took place on Tuesday, and the least (11.7%) on Thursday.
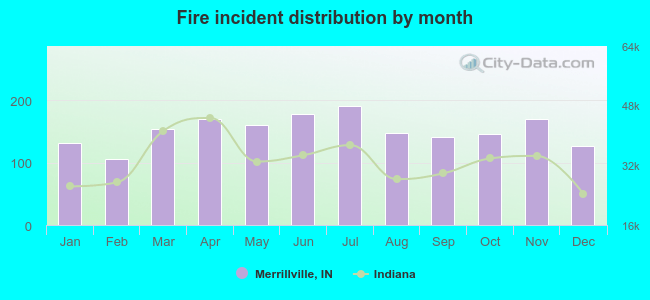 Based on the 1,817 fire incident reports from years 2004 - 2017 most fires (10.5%) took place during July, and the least (5.8%) in February.
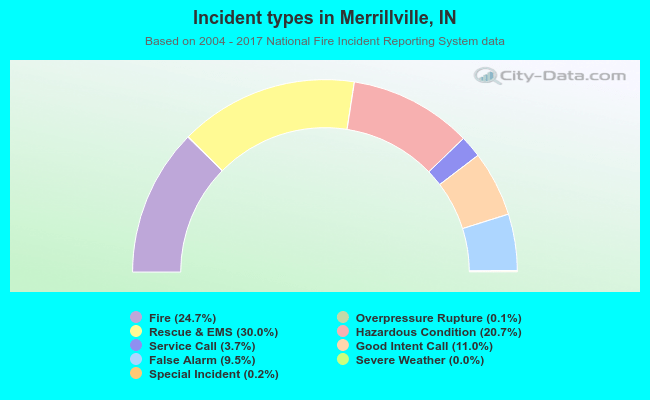 Out of all 7,345 cases reported during the years 2004 - 2017, the most belonged to the categories: Rescue & EMS (30.0%), Fire (24.7%), and Hazardous Condition (20.7%).
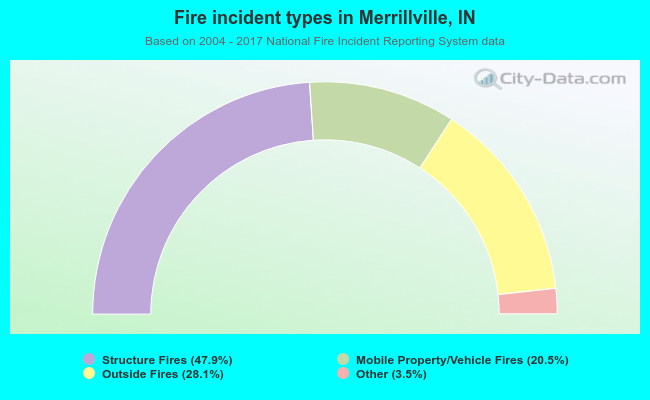 When looking into fire subcategories, the most reports belonged to: Structure Fires (47.9%), and Outside Fires (28.1%).