East Chicago: Fire Incidents, Indiana (IN)
Where are fire incidents reported in East Chicago, IN
Something went wrong! Please refresh the page.
| Fire incidents reported | |
|---|---|
| Sreet name | Count |
| INDIANAPOLIS BLVD | 176 |
| GUTHRIE ST | 152 |
| BROADWAY ST | 128 |
| BARING AVE | 126 |
| COLUMBUS DR | 114 |
| CHICAGO AVE | 110 |
| MAGOUN AVE | 108 |
| FIR ST | 106 |
| PARRISH AVE | 86 |
| TOD AVE | 82 |
| NORTHCOTE AVE | 80 |
| IVY ST | 74 |
| ELM ST | 70 |
| OLCOTT AVE | 70 |
| HOMERLEE AVE | 68 |
| PULASKI ST | 64 |
| DRUMMOND ST | 62 |
| RAILROAD AVE | 62 |
| ALDER ST | 60 |
| CAREY ST | 60 |
| KENNEDY AVE | 58 |
| GRAND BLVD | 54 |
| MCCOOK AVE | 54 |
| EUCLID AVE | 52 |
| DEAL ST | 50 |
| MAIN ST | 48 |
| MELVILLE AVE | 48 |
| 151ST ST | 44 |
| BUTTERNUT ST | 42 |
| DEODAR ST | 40 |
2004 - 2017 National Fire Incident Reporting System (NFIRS) incidents
- Incident types reported to NFIRS in East Chicago, IN
- 3,05738.8%Rescue & EMS
- 1,97025.0%Fire
- 1,40817.9%Hazardous Condition
- 5797.4%False Alarm
- 5396.8%Good Intent Call
- 3033.8%Service Call
- 110.1%Special Incident
- Fire incident types reported to NFIRS in East Chicago, IN
- 80841.0%Structure Fires
- 66433.7%Outside Fires
- 35217.9%Mobile Property/Vehicle Fires
- 1467.4%Other
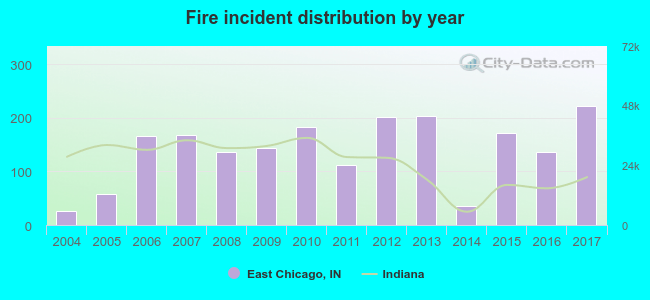 According to the data from the years 2004 - 2017 the average number of fires per year is 141. The highest number of reported fires - 223 took place in 2017, and the least - 27 in 2004. The data has an increasing trend.
The average number of yearly fire incidents per 10k residents in East Chicago, IN compared to nearest cities:
(Note: Based on data for the last 3 years, including only cities with population 5,000 and above)
| East Chicago: | 61.9 |
| Hammond: | 0.1 |
| Highland: | 16.3 |
| Munster: | 15.9 |
| Gary: | 11.3 |
| Griffith: | 3.6 |
| Dyer: | 18.9 |
| Schererville: | 13.3 |
| Lake Station: | 22.2 |
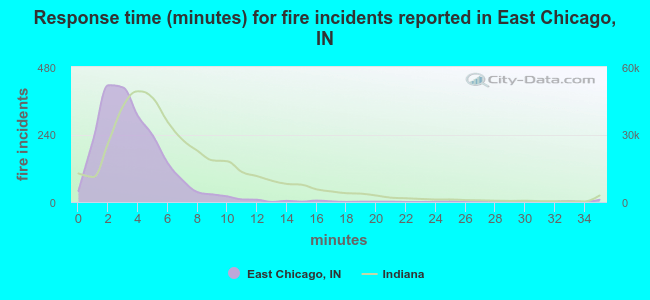 The median response time based on all reported fire incidents is 3 minutes. This is much lower than the state median value.
The median response time in East Chicago, IN compared to nearest cities:
(Note: Based on data for all years, including only cities with at least 500 fire incidents)
| East Chicago: | 3 minutes |
| Hammond: | 4 minutes |
| Burnham: | 7 minutes |
| Calumet City: | 5 minutes |
| Highland: | 7 minutes |
| Munster: | 6 minutes |
| Lansing: | 3 minutes |
| Dolton: | 5 minutes |
| Gary: | 5 minutes |
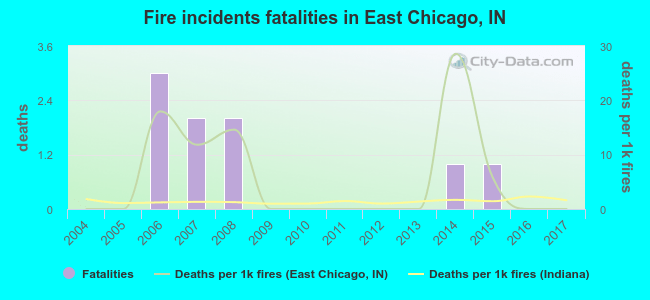 According to the data from the years 2004 - 2017 the average number of fire-related fatalities per year is 1. The highest number of deaths - 3 took place in 2006, and the lowest - 0 in 2004. The data has a constant trend.
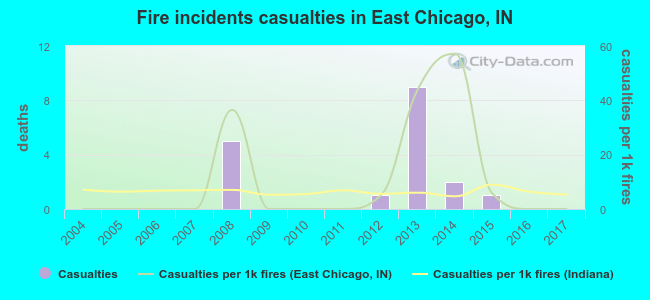 According to the reports from the years 2004 - 2017 the average number of fire-related casualties per year is 1. The highest number of reported casualties - 9 took place in 2013, and the lowest - 0 in 2004. The data has a constant trend.
The average number of injuries per 1,000 fire incidents is 11. This indicator was the highest - 57 in 2014, and the lowest 0 in 2004. The trend for injuries per 1,000 fire incidents is constant. Compared to the state value the number of casualties per 1,000 fires is higher.
According to the reports from the years 2004 - 2017 the average number of fire-related casualties per year is 1. The highest number of reported casualties - 9 took place in 2013, and the lowest - 0 in 2004. The data has a constant trend.
The average number of injuries per 1,000 fire incidents is 11. This indicator was the highest - 57 in 2014, and the lowest 0 in 2004. The trend for injuries per 1,000 fire incidents is constant. Compared to the state value the number of casualties per 1,000 fires is higher.
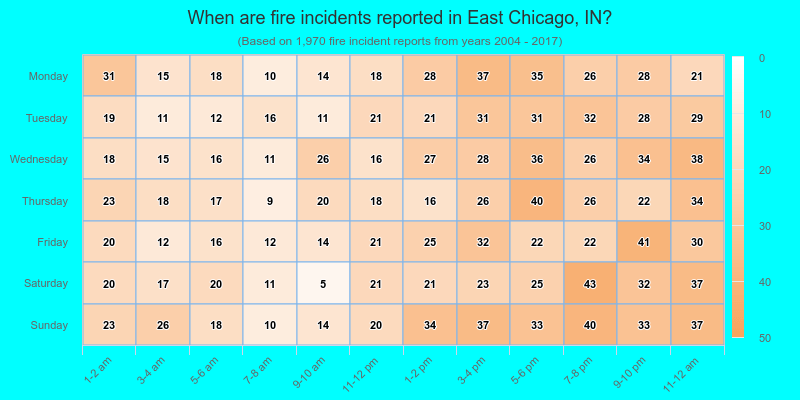
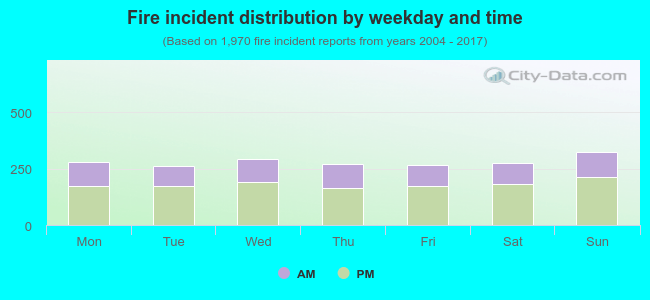 35.7% incidents where reported in the morning and 64.3% in the evening. The most fires (16.5%) took place on Sunday, and the least (13.3%) on Tuesday.
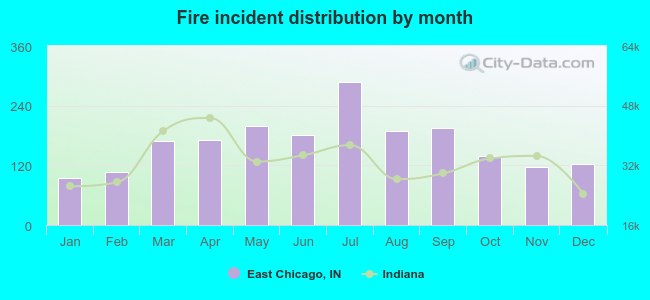 According to the 1,970 fires from years 2004 - 2017 most fires (14.6%) took place during July, and the least (4.8%) in January.
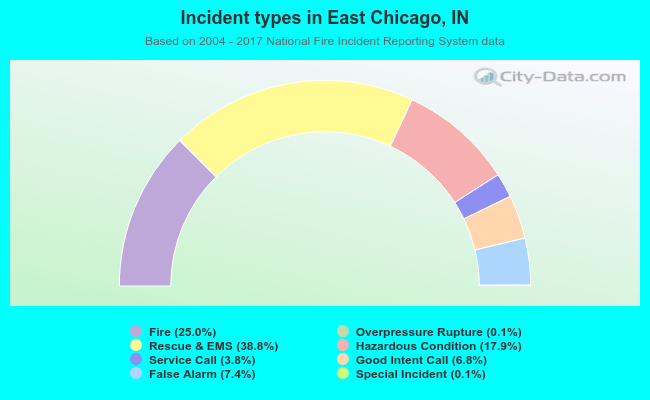 Out of all 7,874 cases reported during the years 2004 - 2017, the most belonged to the categories: Rescue & EMS (38.8%), Fire (25.0%), and Hazardous Condition (17.9%).
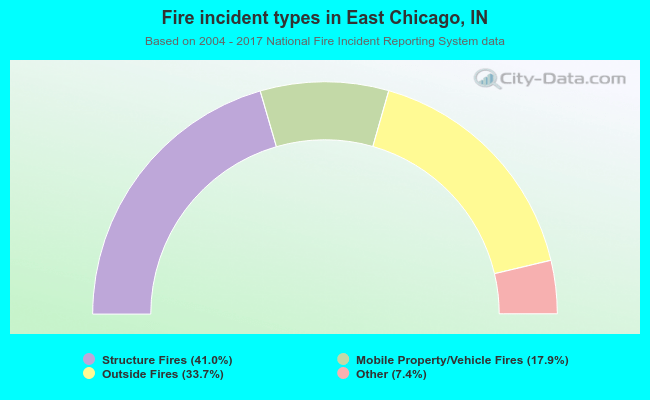 When looking into fire subcategories, the most incidents belonged to: Structure Fires (41.0%), and Outside Fires (33.7%).