Hammond: Fire Incidents, Indiana (IN)
Where are fire incidents reported in Hammond, IN
Something went wrong! Please refresh the page.
| Fire incidents reported | |
|---|---|
| Sreet name | Count |
| CALUMET AVE | 196 |
| HOHMAN AVE | 132 |
| INDIANAPOLIS | 128 |
| 165TH ST | 124 |
| KENNEDY AVE | 112 |
| MICHIGAN ST | 108 |
| SHEFFIELD AVE | 92 |
| 169TH ST | 84 |
| 173RD ST | 76 |
| COLUMBIA AVE | 74 |
| I80 EAST | 70 |
| SIBLEY ST | 64 |
| SUMMER ST | 58 |
| CALUMET | 50 |
| HOFFMAN ST | 44 |
| KENWOOD ST | 44 |
| WALTER AVE | 44 |
| INDIANA TOLL ROAD | 42 |
| ORCHARD DR | 42 |
| 150TH ST | 40 |
| CARROLL ST | 40 |
| LOGAN ST | 40 |
| 169TH | 38 |
| HIGHLAND ST | 38 |
| I80 WEST | 38 |
| STATE ST | 38 |
| 175TH ST | 36 |
| CONKEY ST | 36 |
| GOSTLIN ST | 36 |
| HARRISON AVE | 36 |
| Other | 959 |
2003 - 2015 National Fire Incident Reporting System (NFIRS) incidents
- Incident types reported to NFIRS in Hammond, IN
- 4,62442.0%Rescue & EMS
- 2,95926.9%Fire
- 1,80816.4%Hazardous Condition
- 7366.7%Good Intent Call
- 5014.6%Special Incident
- 1881.7%False Alarm
- 1781.6%Service Call
- Fire incident types reported to NFIRS in Hammond, IN
- 1,06836.1%Outside Fires
- 1,05535.7%Structure Fires
- 59019.9%Mobile Property/Vehicle Fires
- 2468.3%Other
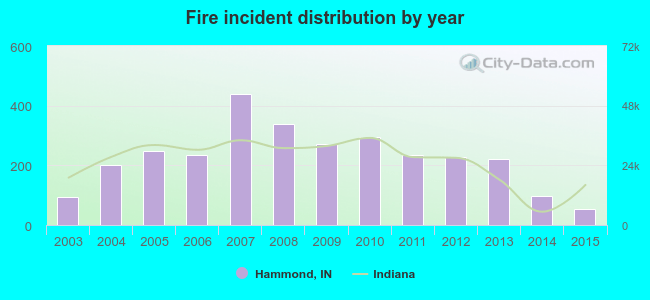 According to the data from the years 2003 - 2015 the average number of fires per year is 227. The highest number of reported fires - 438 took place in 2007, and the least - 54 in 2015. The data has a declining trend.
The average number of yearly fire incidents per 10k residents in Hammond, IN compared to nearest cities:
(Note: Based on data for the last 3 years, including only cities with population 5,000 and above)
| Hammond: | 0.1 |
| East Chicago: | 61.9 |
| Munster: | 15.9 |
| Highland: | 16.3 |
| Griffith: | 3.6 |
| Dyer: | 18.9 |
| Gary: | 11.3 |
| Schererville: | 13.3 |
| Merrillville: | 23.5 |
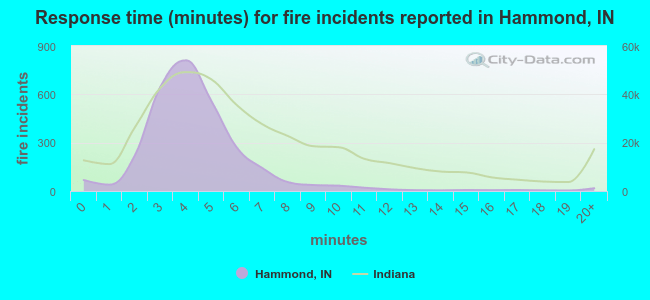 The median response time based on all reported fire incidents is 4 minutes. This is lower compared to the Indiana median value.
The median response time in Hammond, IN compared to nearest cities:
(Note: Based on data for all years, including only cities with at least 500 fire incidents)
| Hammond: | 4 minutes |
| East Chicago: | 3 minutes |
| Calumet City: | 5 minutes |
| Burnham: | 7 minutes |
| Munster: | 6 minutes |
| Lansing: | 3 minutes |
| Highland: | 7 minutes |
| South Holland: | 5 minutes |
| Dolton: | 5 minutes |
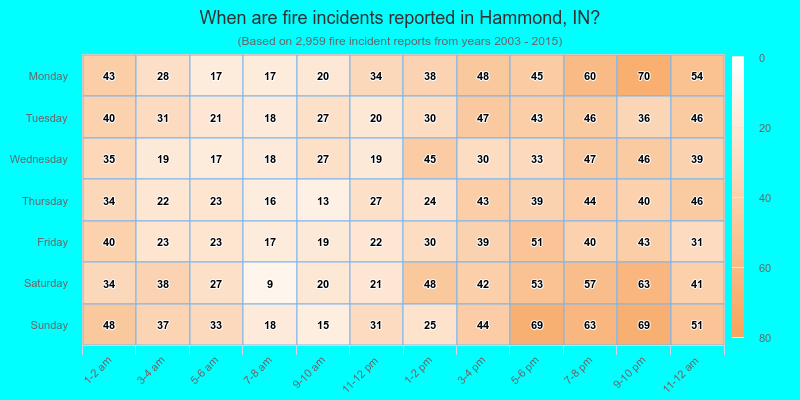
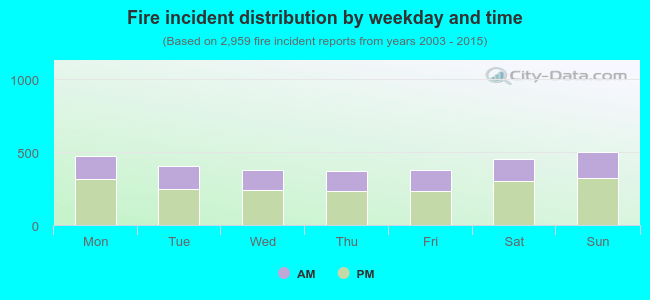 35.9% incidents where reported in the morning and 64.1% in the evening. The most fires (17.0%) took place on Sunday, and the least (12.5%) on Thursday.
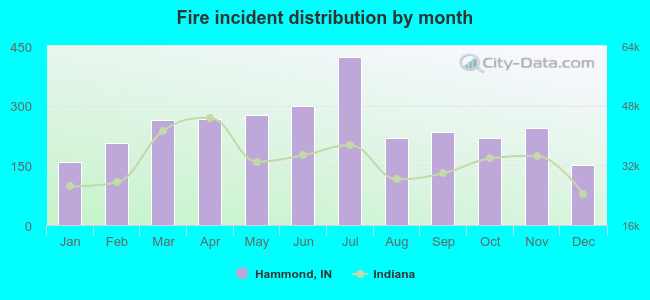 According to the 2,959 fires from years 2003 - 2015 most fires (14.3%) took place during July, and the least (5.1%) in December.
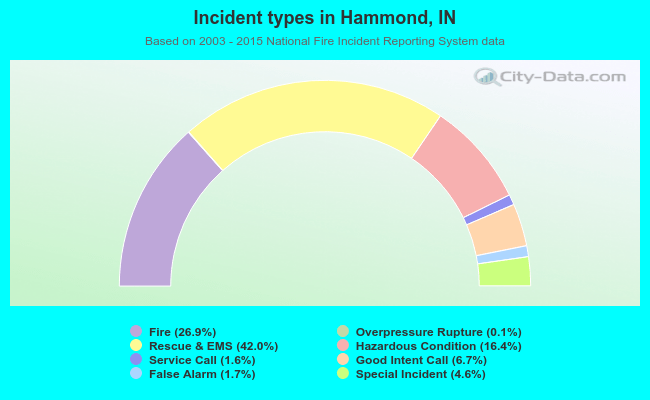 Out of all 11,004 cases reported during the years 2003 - 2015, the most belonged to the categories: Rescue & EMS (42.0%), Fire (26.9%), and Hazardous Condition (16.4%).
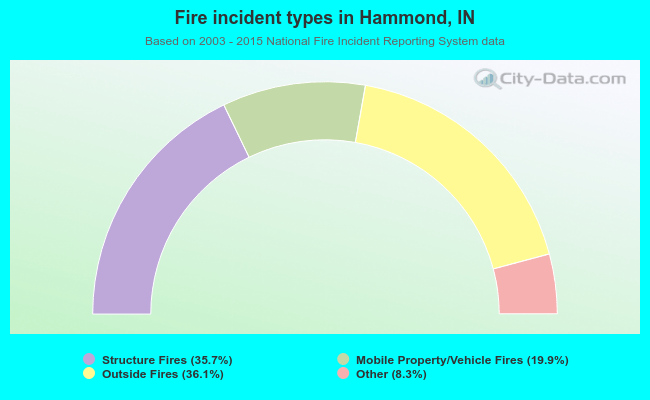 When looking into fire subcategories, the most reports belonged to: Outside Fires (36.1%), and Structure Fires (35.7%).