Lansing: Fire Incidents, Illinois (IL)
Where are fire incidents reported in Lansing, IL
Something went wrong! Please refresh the page.
| Fire incidents reported | |
|---|---|
| Sreet name | Count |
| TORRENCE AV | 348 |
| RIDGE RD | 196 |
| BERNICE RD | 158 |
| BURNHAM AV | 124 |
| 173 CT | 116 |
| 173 ST | 114 |
| TORRENCE AVE | 68 |
| EXCHANGE AV | 64 |
| 174 CT | 62 |
| 175 ST | 60 |
| 178 ST | 52 |
| RIDGEWOOD AV | 52 |
| ROY ST | 52 |
| HENRY ST | 48 |
| WILLIAM ST | 44 |
| 170 ST | 42 |
| BERNICE AV | 42 |
| ARCADIA AV | 40 |
| 186 ST | 38 |
| PARK AV | 38 |
| CHICAGO AV | 36 |
| TORRENCE | 36 |
| I80 EXPY | 34 |
| LORENZ AV | 34 |
| WENTWORTH AV | 34 |
| INDIANA AV | 32 |
| OAKWOOD AV | 32 |
| WALTER ST | 32 |
| WILDWOOD AV | 32 |
| GLEN OAK AV | 30 |
| Other | 201 |
2002 - 2018 National Fire Incident Reporting System (NFIRS) incidents
- Incident types reported to NFIRS in Lansing, IL
- 13,86460.9%Rescue & EMS
- 2,49411.0%Hazardous Condition
- 2,29110.1%Fire
- 2,0649.1%False Alarm
- 1,0914.8%Good Intent Call
- 9084.0%Service Call
- Fire incident types reported to NFIRS in Lansing, IL
- 1,25854.9%Structure Fires
- 53523.4%Outside Fires
- 43418.9%Mobile Property/Vehicle Fires
- 642.8%Other
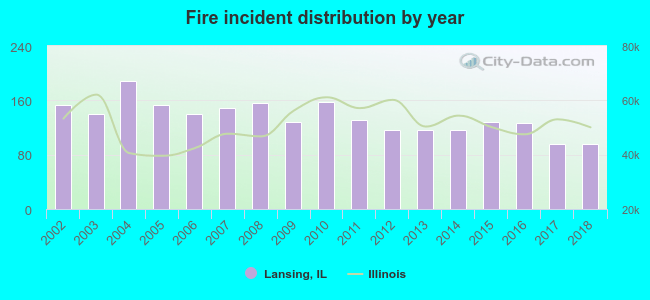 Based on the data from the years 2002 - 2018 the average number of fire incidents per year is 135. The highest number of reported fire incidents - 188 took place in 2004, and the least - 95 in 2018. The data has a declining trend.
The average number of yearly fire incidents per 10k residents in Lansing, IL compared to nearest cities:
(Note: Based on data for the last 3 years, including only cities with population 5,000 and above)
| Lansing: | 37.2 |
| Lynwood: | 23.3 |
| Calumet City: | 61.8 |
| South Holland: | 57.7 |
| Glenwood: | 46.1 |
| Dolton: | 97.7 |
| Sauk Village: | 61.3 |
| Homewood: | 44.9 |
| Chicago Heights: | 29.5 |
 The median response time based on all reported fire incidents is 3 minutes. This is lower compared to the state median value.
The median response time in Lansing, IL compared to nearest cities:
(Note: Based on data for all years, including only cities with at least 500 fire incidents)
| Lansing: | 3 minutes |
| Calumet City: | 5 minutes |
| South Holland: | 5 minutes |
| Glenwood: | 5 minutes |
| Burnham: | 7 minutes |
| Dolton: | 5 minutes |
| Sauk Village: | 8 minutes |
| Homewood: | 5 minutes |
| Chicago Heights: | 4 minutes |
 Based on the data from the years 2002 - 2018 the average number of fire-related fatalities per year is 0. The highest number of reported deaths - 2 took place in 2007, and the lowest - 0 in 2002. The data has a constant trend.
 Based on the data from the years 2002 - 2018 the average number of fire-related casualties per year is 1. The highest number of reported casualties - 3 took place in 2003, and the lowest - 0 in 2002. The data has an increasing trend.
The average number of injuries per 1,000 fire incidents is 10. This indicator was the highest - 23 in 2009, and the lowest 0 in 2002. The trend for injuries per 1,000 fire incidents is growing. Compared to the Illinois value the number of injuries per 1,000 fire incidents is about the same.
Based on the data from the years 2002 - 2018 the average number of fire-related casualties per year is 1. The highest number of reported casualties - 3 took place in 2003, and the lowest - 0 in 2002. The data has an increasing trend.
The average number of injuries per 1,000 fire incidents is 10. This indicator was the highest - 23 in 2009, and the lowest 0 in 2002. The trend for injuries per 1,000 fire incidents is growing. Compared to the Illinois value the number of injuries per 1,000 fire incidents is about the same.Casualties per 1,000 incidents in Lansing, IL compared to nearest cities:
(Note: Based on data for all years, including only cities with at least 500 fire incidents)
| Lansing: | 9.6 |
| Calumet City: | 6.7 |
| South Holland: | 22.0 |
| Glenwood: | 3.1 |
| Burnham: | 5.9 |
| Dolton: | 8.3 |
| Sauk Village: | 5.5 |
| Homewood: | 19.1 |
| Chicago Heights: | 9.6 |
 31.6% incidents where reported in the morning and 68.4% in the evening. The most fires (16.8%) took place on Sunday, and the least (12.5%) on Thursday.
 Based on the 2,291 incident reports from years 2002 - 2018 most fires (11.0%) took place during July, and the least (5.8%) in February.
 Out of all 22,751 cases reported during the years 2002 - 2018, the most belonged to the categories: Rescue & EMS (60.9%), Hazardous Condition (11.0%), and Fire (10.1%).
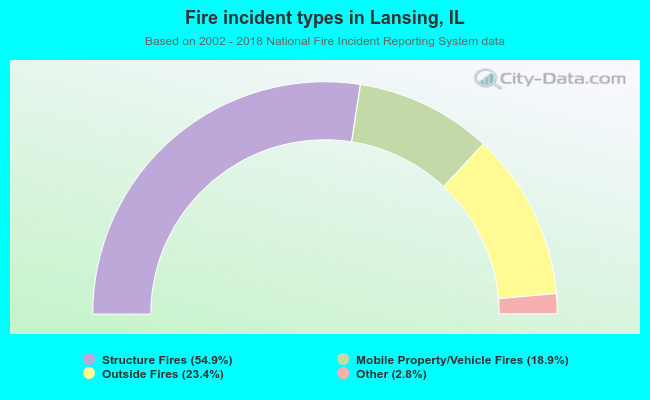 When looking into fire subcategories, the most reports belonged to: Structure Fires (54.9%), and Outside Fires (23.4%).